
Cesar Zamudio, Ph.D.

-Cesar Zamudio, Ph.D., Chapter 7 Author

INTRODUCTION
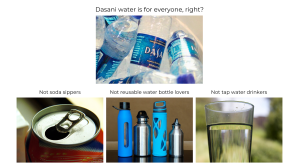
You might be surprised, but a common assumption among entrepreneurs, executives, and ordinary people is that some products are meant “for everyone.” But is that true? Think, for a moment, about a bottle of Dasani purified water. Would everyone want to buy such a bottle? Not really. Some might carry their own refillable bottle; others might prefer to drink soft drinks throughout the day; and some might be comfortable with tap water. This underscores one of the fundamental questions we face every day as marketers: who should our company serve? While, in the words of Bob Dylan, “You gotta serve somebody,” we cannot serve everyone, and some would not even want to be served by us!
Fortunately, marketers have a powerful conceptual toolbox to address this challenge, known as the STP framework. STP stands for Segmentation, Targeting, and Positioning, and is the systematic process by which we identify various unique groups (known as segments) of customers the company might serve, identify the most attractive groups, and develop a unique offering (that is, a mix of 4Ps) that resonates with each group attractive enough to serve. In this chapter, we will discuss each part of the STP framework.
THE MARKETING SEGMENTATION PROCESS
Defining the Reachable Market
Before defining what market segmentation is, we must first understand what a market is. Imagine that you are interested in opening a streetwear store to serve the VCU community. Now, drop a pin right on top of Monroe Park. What would be the right radius around which the store should be?
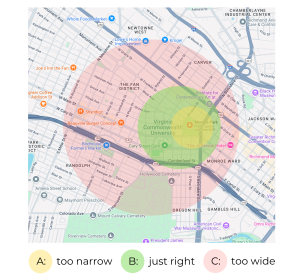
As the three circles above illustrate, a very small radius (A) might allow more precision, but the store would likely “leave money on the table” by failing to serve more consumers—it is too narrow. On the other hand, a very large radius (C) might overstretch the store’s resources—imagine having to advertise and distribute promotional materials in such a large area! A medium radius (B) would most likely strike a good balance among the three options. This radius would delineate the store’s market, defined as the total number of consumers that an organization could potentially serve. This is sometimes referred to as an addressable market in the context of digital marketing.
However, note that within this market, some consumers would simply not be reachable. For instance, according to PwC strategy&, musicians are most credible when associated with a streetwear brand, and so one might want to locate a store relatively close to a city’s vibrant music scene, with locations farther away potentially containing fewer streetwear consumers, and thus being potentially less attractive. At the same time, as alluded to earlier, it might be too costly to promote the store in farther locations. Therefore, this initial market assessment can be adjusted to define a reachable market—the total number of consumers the store could potentially reach and serve feasibly. Defining this reachable market is the first step in the segmentation process, so marketers can later “slice and dice it” to identify valuable consumer groups the company might serve.
Slicing and Dicing with Bases of Segmentation
To recall from Chapter 5 – Strategic Planning, market segmentation is the process of dividing the market into distinct groups of buyers with different needs or characteristics and who might therefore need different products or respond differently to various marketing methods These different groups are known as market segments (or simply segments). The groups, furthermore, must satisfy the MECE (mutually exclusive and collectively exhaustive) rule: a condition by which every potential consumer in the market must belong to a group, and only one group.
 For instance, Uber, the ride-hailing service app, launched Uber Pro, a loyalty program that aimed to “offer competitive perks” for Uber drivers. By completing trips and delivering superior service, Uber drivers can qualify for Blue, Gold, and Platinum tiers, offering an increasingly attractive array of benefits such as gas cashback. Uber drivers are Uber’s main internal customer: an individual or group that is associated within the organization, and which the organization serves. As such, Uber can use the three Uber Pro tiers as different segments of customers they may serve. Because a driver may only be classified within the Blue, Gold, or Platinum tier at one time, the Uber Pro segments satisfy the MECE rule.
In the above example, Uber has segmented its drivers according to the very specific criterion of “Uber Pro status”. In marketing, a myriad such specific criteria exist. Therefore, marketers usually think along the lines of bases of segmentation: a set of general criteria that marketers can use to segment a market, which can later be defined more specifically. There is a wide range of bases of segmentation. Crucially, depending on which base is used, an entirely segmentation solution—defined as a unique configuration of groups emerging by applying one base of segmentation to a given market—will emerge. Let’s outline some of the most important bases of segmentation.
- Geography: The geography base of segmentation requires segmenting the market on the basis of a geographic region. These can be predetermined (for example, using the fifty states of the U.S.), a definition from an authoritative source (such as the official Census Regions and Divisions in the U.S.: Pacific, West, Midwest, South, and Northeast), or a geographic region created by an organization for internal use (such as territories a sales manager might define for their salespeople to serve). These geographic segments can then be served with unique marketing mixes. For example, concerning movies and television shows, Netflix offers different content by country: per PC Mag, as of 2022, the Netflix US library contained 60 Academy-award winning movies vs. Netflix South Korea, which contains 109!
- Demography: The demography base of segmentation is used to construct segments based on demographic characteristics of consumers. For example, in its list of QuickFacts, the Census lists common traits such as age, sex, race, and ethnic origin. These can be used to construct market segments. For example, telecom company Consumer Cellular focuses on the senior citizen target market, offering AARP discounts and even a “GrandPad”: a tablet specifically designed for seniors, focusing on easy-to-understand video calling, thus promising “freedom from the loneliness and isolation that can often accompany aging.”
While an advantage of geographic and demographic segmentation is that they are reasonably easy to define, a disadvantage is that they might hardly be related to consumer behavior at all.
- Behavior: Marketers might also segment using behavioral bases of segmentation, which relate to how people find, evaluate, acquire, use, and dispose of a given product or service, as well as the reasons for acquiring them. For instance, depending on the market segment, a Jeep Cherokee might be used for one of two reasons: off-road driving or city driving, resulting in two distinct market segments. To cater to each segment, Jeep offers Trailhawk and Altitude Lux versions of the Cherokee.
Similarly, for Frito Lay, different market segments might consume a different (average) amount of Cheetos per week, resulting in market segments such as Light, Medium, and Heavy users.
- Psychographics: A psychographic base of segmentation is one that relates to consumers’ psychology, that is, how they perceive themselves, those around them, and their environment. Numerous psychographic bases of segmentation exist. One such base of segmentation is risk aversion: consumers’ tendency to prefer (or avoid) risk. Finance apps such as Robinhood, explicitly segment consumers in this way, claiming that “if we learn from your questionnaire that you are risk-averse, we may recommend investing in a lower-risk portfolio with a greater weight in a bond ETF (exchange-traded fund) because bonds tend to be less risky than stocks and seek to produce income.” Another psychographic base of segmentation is goal-pursuit: consumers’ tendency to care about pursuing goals that promote positive outcomes, or care about pursuing goals that prevent negative outcomes. This is often called “promotion vs. prevention.” An application is the marketing of gym memberships: if a gym owner of a new gym in Richmond called “Earn the Iron” attempts to serve a market segment of promotion-focused individuals, the gym’s marketing might develop ads emphasizing how consumers will improve their physical wellness and attractiveness; but if a segment with prevention-focused individuals is pursued, then Earn the Iron’s ads might emphasize how exercising might prevent future health issues.
- Benefits desired: Finally, an extraordinarily powerful manner to distinguish consumers is based on the benefits they believe they might derive from consuming a product, service, or idea. Benefits segmentation, famously, stems from a classical study by Russel I. Haley in 1968. Haley was interested in classifying toothpaste users going beyond thinking of demographics and behavior, to focus on what caused consumers to buy—in other words, what consumers “wanted to get out of” their toothpaste. Marketing research identified four segments:
- Sociables were those consumers who purchased toothpaste seeking a beautiful and presentable smile to stand out socially and give the best impression.
- Sensitives were those consumers who feel uncomfortable when eating cold foods and in other circumstances due to their sensitive teeth, and thus bought toothpaste to alleviate such discomfort.
- Worriers were those consumers who purchased toothpaste seeking to prevent negative dental health outcomes such as cavities, gingivitis, and such.
- Independents were those consumers who bought toothpaste for mere utilitarian reasons and to save money—just to provide the most basic cleaning.
To apply the “benefits desired” base of segmentation, marketers must carefully discover and delineate these benefits—ideally, through qualitative research first, such as focus groups, followed by a survey or other quantitative method. Benefits segmentation is an example of the old adage that “consumers do not buy drills—they buy holes in their wall.”
Illustrating the Segmentation Process
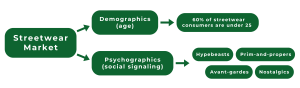
Let’s return to the streetwear store example discussed earlier in the chapter. Which base of segmentation might be most useful to identify MECE consumer segments for the store? One naïve attempt might be to use age, and to then segment the market into (say), young, middle-aged, and older individuals. But, per PwC strategy, more than 60% of streetwear consumers are expected to be under 25 years of age, and thus streetwear is most popular for younger generations. However, consider the myriad examples of streetwear styles available, such as skatewear, techwear, athleisure, and even Harajuku. To provide younger consumers around VCU with a unique streetwear offer that resonates with them, would a crude “young” segment adequately capture the richness of thoughts and opinions of these consumers? Most likely, no.
In a more sophisticated attempt, we could rely on a psychographic base of segmentation, particularly, what consumers might want to communicate through their clothes—we might refer to this as “social signaling”. What segments might emerge by applying this base of segmentation? Here is a potential solution:

- Hypebeasts are those consumers who want to communicate their social status and their connection to street culture through their clothes. Diverse and willing to show off, Hypebeasts love logos, matching patterns and prints, and (perhaps counterintuitively) are quite socially conscious. Browsing feeds and posting fits on the daily, hypebeasts love sharing.

- Prim-and-propers are those consumers who want to communicate elegance and conformity while also desiring to be perceived as creative and sophisticated. One might expect the speech and mannerisms of a prim-and-proper to be highly deliberate, their tailoring impeccable, and their minimalism maximal—with a splotch of color for good measure. Pants are always the perfect length. Everything is consciously chosen.

- Avant-gardes are those consumers who desire to be seen as unique, independent trendsetters at the very bleeding edge of fashion. They know the latest and most obscure designers, and their outfits speak volumes—elongated silhouettes, metallic accessories, and the color black are the main modes of speech. They might be your fashion expert’s favorite fashion experts.

- Nostalgics are those consumers who desire to be seen as laid-back and romantic. They love warm colors, layered cozy fabrics in a multitude of patterns, and a lot of denim. Whether they’re wearing clothes from a farmer’s market or a 1960s catalog, they thrive when thrifting, mixing, and matching. Well-loved wrinkly jackets and DIY are staples.
Note that the descriptions of these segments are deliberately engaging and paint a picture of who these customers might be, their outlook on life, and how they communicate. These are examples of personas: rich segment descriptions that illustrate a typical segment member’s characteristics (such as demographics), needs, wants, aspirations, and daily life. While the above is only a conceptual illustration, to the extent possible, personas should be written using as much data as possible.
To visually represent the segmentation process, it is useful to use a diagram.
Beginning from the left, we can depict and briefly describe the market. Next, we can draw an arrow to represent the base of segmentation we will use. Finally, we can break the market apart into whichever segments we found, displaying each segment as a separate box. Now, think about the two separate segmentation solutions that emerged from applying the two different bases of segmentation discussed earlier (age and social signaling). We can depict them graphically.
These two segmentation solutions are the outcome of the market segmentation process, and you should rely on a visual tool like this one to clarify any segmentation solution. In practice, this means that you have conceptualized the market such that when you consider a new, potential, customer, you can quickly classify them according to one of the two solutions above. So, what’s left to do?
TARGETING, MARKET ATTRACTIVENESS, AND MARKET POTENTIAL
Think back to the beginning of the chapter where we discussed a fundamental truth of marketing: we cannot serve everyone, and some might not want to be served by us. As such, savvy marketers must go beyond merely identifying segments, and determine how attractive each one might be, so that the company might focus on serving only the most attractive.
But in life and in marketing, attractiveness is in the eye of the beholder. Indeed, there are multiple ways in which to think about market attractiveness: an assessment of how attractive a certain market, or market segment, might be, according to multiple criteria. Importantly, not all these criteria are strictly monetary or numerical! For instance, attractive segments…
- Represent a good match between the segments and the company’s brand image;
- Are measurable—such that we can count the number of consumers in the segment, and how attractive they might be financially;
- Are reachable—such that we can feasibly communicate and deliver our offer to them;
- Are of sufficient size and growth—that is, attractive segments are large enough to be financially viable, and if they show an upward size trend, even better!;
- Are not intensely competed for—such that enough members of the segment can become our customers, and not the competition’s.
A useful way to measure market (or segment) attractiveness is known as market potential: a measure of the anticipated monetary value of a market segment. To compute market potential, I personally opt for using a handy tool, which I’ve called “the three-legged stool”(or 3LS), to understand and compute market potential.
- The first leg is size: a numerical estimate of the number of people that comprise a given market segment. This is simply a numerical count of consumers. Remember, by the MECE rule, each consumer can be counted as being a member of one segment only!
- The second leg is likelihood to buy: a numerical estimate of the chance that a typical member of the market segment might buy a given product or service. Because this assessment is numerical, this is generally expressed as a percentage between 0% to 100%. So, for example, in a segmentation solution with two segments, A and B, their likelihood to buy might be 40% (for A) and 80% (for B). Therefore, B is twice as likely to buy the product than A.
- The third leg is willingness-to-pay: a numerical estimate of the dollar amount that a typical member of the market segment might pay for a given product and service.
To use the 3LS, you must obtain the three estimates above for each market segment you have discovered. Then, by multiplying the three estimates for each segment, the market potential for each is uncovered. Note that, in some situations, it might be impossible to obtain numerical estimates—in lieu of these, qualitative assessments (e.g., “high,” “medium,”and “low”) can be used, at the cost of precision.
To illustrate the use of the 3LS, picture yourself in the near future—a successful marketing executive who has been hired by the company behind Clicks, a new iPhone case which features a physical phone presenting itself as “the first keyboard for iPhone.”

You have deployed a survey, and your team has discovered the following segmentation solution:
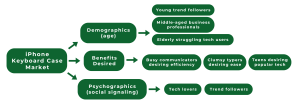
Suppose that you opt to pursue the Psychographics (social signaling) solution. Therefore, you will have to target each of the two segments. Which one would you pursue? The three-legged stool can help:
| Criteria/Segment | Tech lovers | Trend followers |
|---|---|---|
| Segment size
Total market size: 1’350,450 consumers |
540,180 consumers (40% of market) | 810,270 consumers (60% of market) |
| Willingness to pay | $60 | $35 |
| Likelihood to buy | 55% (0.55) | 40% (0.4) |
| Estimated market potential
(multiply the criteria per segment) |
$17’825,940 | $11’343,780 |
Note that this segmentation solution presents the total market size alongside all information needed to compute market potential. However, a more engaging solution would also rely on the concept of personas to provide an engaging and useful description of each segment along multiple characteristics to paint a picture of their daily life.
Like a detective on the hunt for a suspect, the segmentation solution lines each segment up, and your goal is to pick the most attractive segment(s) for the company to serve. In this case, what would you recommend to Clicks? What do you conclude? The solution is the Tech Lovers, as their market potential is the largest.
Finally, the preceding examples illustrate that all three legs should be strong for the three-legged stool of market attractiveness to stand—if one is too small, by multiplying the three, the overall market potential will be low. At the same time, if you miss one, your conclusions could be misleading. For example, if you only had segment size, you might erroneously conclude that the Trend Follower segment is more attractive. So remember all three!
POSITIONING
As marketers, even though we might have identified an intriguing segmentation solution, with segments that might appear very attractive, our actions do not happen in a vacuum. The reality is quite the opposite of a closed-off set of variables: marketers must always consider the competitive environment because what we offer consumers will always be judged relative to what other competing options are. Remember, “it’s not what you think, it’s what they think”!
To increase the likelihood that marketers will successfully compete, they must position their brand adequately. Positioning is the process of discovering the position of a particular brand in the mind of the consumer, relative to other competitors’ brands. Note that, in this discussion, a “brand” can refer to a company’s brand image itself, but also to certain products and services the company offers. Importantly, marketers might want to engage in head-to-head positioning, by explicitly stating how their brand is better from competitors’; or in differentiation, by focusing on what makes their offering unique and different from competitors’.
One of the classical tools in marketers’ arsenals to determine a brand’s position in the consumer’s mind is known as a perceptual map: a visual representation of the two major dimensions along which consumers perceive a set of competing brands, intended to represent a map of consumers’ minds. A perceptual map consists of two axes perpendicular to each other, forming a coordinate map. Importantly, several competing brands must be placed in the map—therefore, the map clearly indicates each brand is placed there. While sometimes managerial judgment can be used to this effect, savvy marketers rely on surveys and sophisticated methods such as factor analysis to construct these maps. But, regardless of the method and data used, the result is always an easy-to-interpret map to assess a certain brand’s competitive position relative to others, and, potentially, a path to repositioning.

SUMMARY
We began by looking at the considerations companies should analyze when determining their reachable market. Further, the nuances of segmentation were discussed, in addition to the different bases of segmentation (geography, demography, behavior, psychographics). Next, you read about the value of “benefits desired” segmentation, or segmentation based on benefits consumers think they will derive from consuming a product, service, or idea. The psychographic base of segmentation was applied to a real-world example of streetwear to show how different consumers think about clothings’ relationship with their self-image. Also, we covered how marketers can’t simply identify target segments, they need to evaluate the attractiveness of these segments based on specific criteria. Relatedly, the 3 Legged Stool (3LS), a tool for computing market potential consisting of size, likelihood to buy, and willingness-to-pay, was introduced. Finally, you read about how positioning—the process of discovering the position of a particular brand in the mind of the consumer, relative to other competitors’ brands—is crucial for marketers to compete. On this point, the perceptual map can be a tool to help determine the position of a brand in consumers’ minds.
REFERENCES
“Streetwear: the new exclusivity.” strategy&. PwC. https://www.strategyand.pwc.com/de/en/industries/consumer-markets/streetwear/streetwear-the-new-exclusivity.pdf. Accessed October 18, 2024.
“Meet the new Uber Pro.” Uber Blog. https://www.uber.com/blog/meet-the-new-uber-pro/#:~:text=In%202018%2C%20we%20launched%20Uber,want%20to%20recognize%20your%20efforts. Accessed October 18, 2024.
“Enjoy Like a Pro.” Uber.com. https://www.uber.com/us/en/drive/uber-pro/?id=998656&uclick_id=758104d4-9815-4d49-a441-5b861bf8fdfd. Accessed October 18, 2024.
“Census Regions and Divisions of the United States.” U.S. Census Bureau. https://www2.census.gov/geo/pdfs/maps-data/maps/reference/us_regdiv.pdf. Accessed October 18, 2024.
Cohen, Jason. “These Countries Have the Best Netflix Catalogs.” PC Mag. https://www.pcmag.com/news/these-countries-have-the-best-netflix-catalogs. Updated December 23, 2021.
“QuickFacts.” U.S. Census Bureau. https://www.census.gov/quickfacts/fact/table/US/PST045222. Accessed October 18, 2024.
“Grandad Powered by Consumer Cellular.” Consumer Cellular. https://www.consumercellular.com/shopping/details/grandpad/overview. Accessed October 18, 2024.
“First trade recommendations.” Robinhood. https://robinhood.com/us/en/support/articles/first-trade-recommendations/. Accessed October 18, 2024.
Haley, Russell. “Benefit Segmentation: A Decision-Oriented Research Tool.” Journal of Marketing. Vol. 32, No. 3. https://www.jstor.org/stable/1249759. July 1968.
“Enhance your iPhone with a real keyboard.” Clicks. https://www.clicks.tech/. Accessed October 8, 2024.
Media Attributions
- Header by Z. Farley
- Thirsty? by Josh Hallett, licensed under CC BY 2.0, Soda by Jannes Pockele, licensed under CC BY 2.0, Water Bottles by World’s Direction, licensed under CC0, Waterefraction by Alan Levine, licensed under CC BY-SA 2.0
- VCU map from Google Maps
- Uber ride by Alexander Torrenegra, licensed under CC BY 2.0
- Streetwear zip up hoodie by Hoodype, licensed under CC BY-SA 2.0
- Woman Portrait by gdhllz, licensed under Pixabay license
- Fashion by SJJP, licensed under Pixabay license
- Fashion model by Pexels, licensed under Pixabay license
- Chart by Z. Farley
- Image generated with Midjourney AI
- Fig. by Z. Farley
- Fig. by Z. Farley
Segmentation, targeting, and positioning. Is the systematic process by which we identify various unique groups (known as segments) of customers the company might serve, identify the most attractive groups, and develop a unique offering (that is, a mix of 4Ps) that resonates with each group attractive enough to serve
The total number of consumers that an organization could potentially serve
The total number of consumers the store could potentially reach and serve feasibly
Different, unique groups marketers split people into
A condition by which every potential consumer in the market must belong to a group, and only one group
An individual or group that is associated within the organization, and which the organization serves
A set of general criteria that marketers can use to segment a market, which can later be defined more specifically
A unique configuration of groups emerging by applying one base of segmentation to a given market
The geography base of segmentation requires to segment the market on the basis of a geographic region
The demography base of segmentation is used to construct segments based on demographic characteristics of consumers
Marketers might also segment using behavioral bases of segmentation, which relate to how people find, evaluate, acquire, use, and dispose a given product or service, as well as the reasons for acquiring them
The study of consumer personality and their values and lifestyles
Consumers’ tendency to prefer (or avoid) risk. Is a psychographic base of segmentation
Consumers’ tendency to care about pursuing goals that promote positive outcomes, or care about pursuing goals that prevent negative outcomes. Is a psychographic base of segmentation
A manner to distinguish consumers based on the benefits they believe they might derive from consuming a product, service, or idea. Is a psychographic base of segmentation
Rich segment descriptions that illustrate a typical segment member’s characteristics (such as demographics), needs, wants, aspirations, and daily life
An assessment of how attractive a certain market, or market segment, might be, according to multiple criteria
A measure of the anticipated monetary value of a market segment
The process of discovering the position of a particular brand in the mind of the consumer, relative to other competitors’ brands
Directly and explicitly stating how their brand is better from competitors
Setting the company's market offering apart to provide consumers with more value
A visual representation of the two major dimensions along which consumers perceive a set of competing brands, intended to represent a map of consumers’ mind