
Cesar Zamudio, Ph.D.

-Cesar Zamudio, Ph.D., Chapter 6 Author

INTRODUCTION
Picture yourself in the near future. As a young marketing executive, your reputation precedes you. You have been called by a friend—a local entrepreneur who aims to open a restaurant in the hotly competitive Richmond market. Your task? Determine whether the restaurant should be opened (or not!) and which cuisine it should serve. What would you do?
Don’t panic. Remember your training! You’re a marketer. And as Marty Neumeier, author of The Brand Gap puts it, “It’s not about what you think. It’s about what they think.” Therefore, as a marketer, your first instinct should always be to ask consumers! You might choose to distribute a survey to the local Richmond community to find out more about their restaurant interests. Potentially, you could also consider assembling a group of customers and asking them to discuss their favorite and not-so-favorite restaurants. Others might choose to gather and read reports from the Virginia restaurant industry to gain a broad knowledge of restaurant competition. A few might even suggest scraping reviews from Yelp.com or comments from social media platforms and immersing themselves in the online chatter of the Richmond restaurant scene.
What do you think of the above approaches? Are they right? Wrong? Consider this question for a moment.
In truth, all of the above approaches are valid and complementary. They are all methods savvy marketers should use to accomplish the same fundamental goal—to listen to the voice of the consumer by gathering information from a variety of sources. Marketing researchers, as one author puts it, are akin to “information detectives.”
Why is it important for marketers to have such information? To put it simply, consumer information is a competitive advantage that adds value to companies. If your company knows about consumer preferences, interests, and values, and your competitors don’t, the likelihood that you will succeed in competing against them increases. For example, if you are a baseball mitt company, finding out that baseball players now desire gloves that are solid-colored and built with “H-Web” webbing will put you at an advantage over your competitors. Of course, this is not a guarantee, but when it comes to making serious, potentially multi-million dollar business decisions that can impact your life as well as that of your colleagues and employees, a little insurance goes a long way.
Marketing research is the process of gathering information to learn about the voice of the consumer. Luckily for us, it is a rather formal process, and we can rely on the steps of this process to orient us as we go along.
The Marketing Research Process
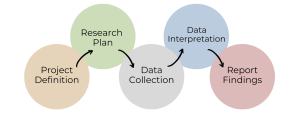
As you can see, the marketing research process is vast. As such, we will only scratch its surface by discussing some of the key concepts and activities marketing researchers engage in. Particularly, when it comes to investigation, we often think of sources and methods—we will discuss these next as they relate to consumer information.
QUALITATIVE AND QUANTITATIVE MARKETING RESEARCH METHODS
To gather information, marketing researchers rely on a myriad of different and complementary methods. These methods always rely on consumer information as input (whether from in-person conversations, surveys, online reviews, industry reports, or other sources), but their outputs can be very different. Let’s briefly introduce three common methods that marketing researchers employ.
- A focus group is a method in which a discussion leader guides a group of consumers in a discussion of a specific topic, such as their opinion on a new product or service. In contrast, in an in-depth interview, an interviewer questions one consumer at a time. In focus groups—in which generally 8 to 12 consumers participate at the same time—the emphasis is on allowing consumers to discuss amongst themselves, which can reveal information that may otherwise not be gathered. During in-depth interviews, on the other hand, emphasis is placed on privacy, and therefore this is an ideal method for sensitive topics such as consumers’ sexuality or personal experiences—in a group environment, consumers might be unwilling to disclose such information.


In either method, the discussion leader relies on a discussion guide: a predetermined set of questions that helps the leader steer the discussion to uncover the information the company needs. Questions are generally open-ended questions: questions which do not have predefined answers, and which consumers can answer by freely giving their thoughts. As you might imagine, these two methods are rather time-consuming, and the total number of consumers that the marketing researcher interviews (also known as a sample) is somewhat small. Whether one relies on focus groups or interviews, their output is essentially the same: video recordings, audio recordings, and transcripts, which marketing researchers then analyze to identify major themes mentioned by consumers.
- A survey is a series of questions, structured in the form of a physical or electronic document (also called instrument), that marketing researchers distribute to consumer respondents. When deploying a survey, the marketing researcher seldom interacts with consumers. Instead, consumers fill out the survey instrument with pen-and-paper, a computer, or tablet. Surveys rely heavily on closed-ended questions: questions with a preconstructed set of choices that respondents must select from to represent their opinions. Surveys can be cheaply and quickly deployed to hundreds of respondents across geographic regions—hence, the total sample for a survey is generally large, in the three-digit range. The output of a survey is a structured dataset, in matrix form (you can visualize this in your mind as a very large table or Excel spreadsheet), where each row represents one consumer survey, and each column contains consumers’ responses to each question or item. Marketing researchers statistically analyze all of these responses simultaneously to describe consumers—for example, their average interest in the Virginia Museum of Fine Arts, or the typical dollar amount they might be willing to pay for a can of Starbucks Doubleshot.


These are only three methods, with an enormous variety left for you to explore in your MKTG-310 Marketing Research course—and beyond! However, to make sense of all these methods, marketing researchers have conceptualized a useful way to distinguish methods based on their output—namely, whether they generate qualitative and quantitative data.
Qualitative data is data that cannot be statistically analyzed. It is generally smaller in size and consists of audio, video, and transcripts. As its name implies, qualitative data speaks to qualities that hard numbers might not be able to capture—consumers describing their emotions, interests, and opinions in a personal way. This richness is what distinguishes qualitative data, and why it is so valuable. However, qualitative data takes longer to collect, and its fickle, small-size nature means that researchers should not generalize findings using this data to the broader consumer population. Beyond what we discussed, many other methods exist, such as ethnography, a method in which a researcher immerses themselves in the daily lives of consumers and their communities to learn about them, or netnography, which is ethnography in the context of the Internet and social media.
On the other hand, quantitative data is data that can be statistically analyzed. It is generally much larger in size and consists of data in matrix form. As its name suggests, quantitative data deals with quantities—numbers that, because they come from many consumers, can be analyzed statistically. This means marketers might potentially draw conclusions and generalize some of their findings using this data to the consumer population. By its very nature, consisting of data that arises from closed-ended questions or measurements, however, quantitative data does not allow the richness one might find in qualitative data. While survey research is the primary method that generates quantitative data, other methods exist, such as laboratory and field experiments.
Test your knowledge of quantitative vs. qualitative data by dragging the slider to the left.
PRIMARY AND SECONDARY MARKETING RESEARCH DATA SOURCES
The methods we have discussed so far are like tools—they allow us to collect consumer information in one, very specific, manner, which can produce qualitative or quantitative data as a result. However, as marketing researchers, there is another very useful way to conceptualize how consumer information is gathered. Instead of thinking about methods (qualitative, quantitative) we can also think about sources: the persons, places, or resources from which we gather such information. Below, we briefly discuss some of these sources of information, and will then discuss two general approaches to understand them.
- Database marketing is a method in which researchers tap into a company’s existing customer database, and “mine” that data using various sophisticated statistical methods to detect patterns and insights that the company might find useful (very large databases of customer information are referred to as big data). Crucially, because database marketing relies on data that already exists in a company, marketing researchers gain the convenience of having data ready to study; on the downside, this data is not entirely customized, and so insights will be limited to the data at hand.
- Industry reports are a common source employed by marketing researchers. Industry reports are publications, released periodically and programmatically by authoritative sources, which contain information about a certain topic of interest to the marketing researcher. For example, the American Customer Satisfaction Index (ACSI) releases reports detailing the current customer satisfaction outlook of multiple industries, such as the automotive industry (the process of generating reports summarizing multiple industries, consumers, regions, and so forth, is known as data aggregation). The ACSI releases their reports periodically (because such reports are generally released every quarter) and programmatically (because these reports continue to be released over time); hence, the ACSI allows marketing researchers to conveniently access customer satisfaction information on an industry of their choice, and gain a historical view.
Note that, with the advent of the Internet, authoritative industrial report sources, such as Mintel, IBISWorld, or Passport (these three databases are available for free at the VCU Library!) release large periodic reports as well as a considerable variety of smaller reports that deal with current topics. As with big data, note that industry reports offer quick, often critical, insights, but they are not customized to a given researcher’s needs.
Check out a real life example of a report!
Click this link: guides.library.vcu.edu/az.php
Type in the search bar “Mintel”

Sources such as the above, in which the data used by the marketing researcher already exists, are known as secondary data sources.
Many others, such as online reviews and social media chatter, exist. In contrast, primary data sources are those sources in which the data is generated by the marketing researcher. It is fresh and new to the world. Think about some of the methods we discussed above: whether focus groups, interviews, or surveys, all of these methods rely on an original discussion guide or survey instrument created by the researcher—hence, the responses given are entirely new. As you might guess, relative to secondary data, the advantages and disadvantages of primary data are polar opposites: for primary data, data takes longer to collect, but the insights are customized to the researcher’s needs.
Test your knowledge of primary vs. secondary sources by dragging the slider to the left.
Now, it’s important for a final word about sampling. Before we move on, we need to briefly stop and realize that all the wonderful data discussed so far does not exist in a vacuum. Rather, it is actively gathered by marketing professionals. When the data is secondary (for example, for database marketing) the data is automatically gathered. However, when primary data is concerned, sampling, that is, the process of determining the subset of respondents, from within a larger population, that will be the target for data collection, is worth discussing.
But first, let’s imagine that you are interested in opening a pizza restaurant in downtown Richmond, specifically around VCU’s Monroe Park campus. If you have been paying attention, the immediate, and first step would be to conduct research! For example, you might want to deploy a survey in the area, or interview potential customers in person. So, where would you start?
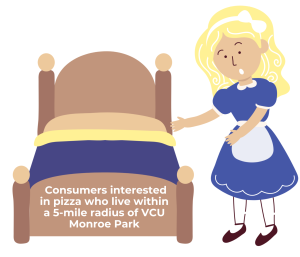
The very first step would be to identify the population: all of the potential customers you are interested in investigating. This sounds very scientific (and it is!) but it also requires some business acumen. For example, if you define your population as “everyone in Virginia”, you’d likely hear from folks who will never even be in the vicinity of your new pizzeria. Conversely, if you define your population as “everyone that studies at VCU Monroe Park,” you would fail to hear the thoughts of a lot of potential customers that either are not students, or do not live that close to the new pizzeria but might still feasibly come and dine with you frequently. Therefore, in this step, we have to wear our scientists’ lab coat and our Monopoly man’s hat at the same time. In this case, for instance, you might want to define the population as: “Consumers interested in pizza who live within a 5-mile radius of VCU Monroe Park”. Here, the good old Goldilocks principle is always best: not too close, not too far.


Of course, we cannot interview or survey everyone in the population (which is known as a census)—instead, we will target only some population members. As we mentioned, the process of determining the subset of respondents, from within a larger population, that will be the target for data collection, is known as sampling. Continuing with our example, supposing that 5,000 potential consumers constitute the population of interest, we might end up “sampling” (that is, recording responses from) 250 respondents. Is this a lot? Is this a little? That is a question that statisticians have a lot to say about, and as you learn more about marketing research, you will familiarize yourself with tools that can allow you to determine what is the minimum sample size needed to achieve your research goals. However, samples of a couple of hundred respondents can be surprisingly accurate. In a nutshell, responses from our survey, coupled with statistical models, allow us to conduct statistical inference: the process of learning about characteristics of the population of interest using only a sample and statistical methods. For instance, a small, 250-respondent survey might allow you to measure respondents’ likelihood to visit your pizzeria, their attitude towards different draft logos, and their preference for various toppings, quite reliably! That is the power of statistics.
Between defining the population, and actually sampling the population, however, there is an important step, which is the use of a sample frame. A sample frame is a list or database that researchers use to select who will be sampled. For example, you might have access to a paid email list of a good chunk of people who live in downtown Richmond, or a comprehensive list of large social media groups you could tap into. While all of these sampling frames have advantages and disadvantages, they constitute a more concise list from where respondents might be drawn. And that drawing comes in two flavors.
- Non-probabilistic sampling is an approach in which you do not select from the sampling frame at random. You might not have a sampling frame at all! For example, when deploying surveys that are conducted on a particular site (known as intercept surveys) the researcher and his or her team will seek responses from anyone in the vicinity. When conducting interviews on a sensitive topic, such as gender attitudes, a snowball sampling method, in which each respondent is encouraged to provide a list of “informants” that the researcher can target next, is also non-probabilistic. Finally, a sample in which whomever was available was selected is known as a convenience sample. While non-probabilistic sampling tends to be much easier, the biggest drawback is that non-probabilistic samples cannot be used to conduct statistical inference! Hence, such sampling method is best left for exploring a given topic, rather than seeking hard evidence or confirmation of a certain research question.
- In contrast, probabilistic sampling is an approach in which the selection of members of the sampling frame to be included in your sample is random, which allows statistical inference to be performed. The biggest advantage is generalizability—a truly random sample will allow you to extrapolate (with a certain degree of confidence) the findings from your survey to the entire population.
SUMMARY
In summary, the chapter began by discussing broadly why marketing research plays a crucial role in giving companies a competitive advantage over rival businesses. Immediately after, we dove into the differences between quantitative and qualitative data, as well as the advantages and disadvantages of each. Next, the types of information sources used by marketing researchers were covered. Finally, sampling was explained, in addition to the strengths and weaknesses of probabilistic and non-probabilistic sampling.
REFERENCES
Neumeier, Marty. The Brand Gap: How to Bridge the Distance Between Business Strategy and Design. New Riders, 2005.
Media Attributions
- Header by Z. Farley
- Chart by Z. Farley
- Man on a Job Interview by Amtec Photos, licensed under CC BY-SA 2.0
- Focus group debriefing by Bright Planet, licensed under CC BY-SA 2.0
- Survey by andibreit via Pixabay, licensed under Pixabay content license
- Analysis by Pexels via Pixabay, licensed under Pixabay content license
- Screenshot 2024-11-04 at 10.53.04 AM
- 1 copy 14
- 2 copy 15
- 3 copy 8
The process of gathering information to learn about the voice of the consumer
A method in which a discussion leader guides a group of consumers to discuss a specific topic, such as their opinion on a new product or service
An interviewer questions one consumer at a time
A predetermined set of questions that helps the leader steer the discussion to uncover the information the company needs
Questions which do not have predefined answers, and which consumers can answer by freely giving their thoughts. Generally used in focus groups
The total number of consumers that the marketing researcher interviews in focus groups
A series of questions, structured in the form of a physical or electronic document (also called instrument), that marketing researchers distribute to consumer respondents
Questions with a preconstructed set of choices that respondents must select from to represent their opinions
Data that cannot be statistically analyzed
A method in which a researcher immerses themselves in the daily lives of consumers and their communities to learn about them
Ethnography in the context of the Internet and social media
Data that can be statistically analyzed
A method in which researchers tap into a company's existing customer database, and "mine" that data using various sophisticated statistical methods to detect patterns and insights that the company might find useful
Very large databases of customer information
Publications, released periodically and programmatically by authoritative sources, which contain information about a certain topic of interest to the marketing researcher
The process of generating reports summarizing multiple industries, consumers, regions, and so forth
Sources in which the data used by the marketing researcher already exists
Sources in which the data is generated by the marketing researcher
The process of determining the subset of respondents, from within a larger population, that will be the target for data collection
All of the potential customers you are interested in investigating
An interview or survey of everyone in the population
The process of learning about characteristics of the population of interest using only a sample and statistical methods
A list or database that researchers use to select who will be sampled
An approach in which you do not select from the sampling frame at random
Surveys that are conducted on a particular site
A method in which each respondent is encouraged to provide a list of “informants” that the researcher can target next
A sample in which whomever was available was selected
An approach in which the selection of members of the sampling frame to be included in your sample is random, which allows statistical inference to be performed