
13 Experimental design
Chapter Outline
- Designing a questionnaire for surveys or experiments (38 minute read)
- What is an experiment and when should you use one? (8 minute read)
- True experimental designs (7 minute read)
- Quasi-experimental designs (8 minute read)
- Non-experimental designs (5 minute read)
- Critical, ethical, and critical considerations (5 minute read)
Content warning: examples in this chapter contain references to non-consensual research in Western history, including experiments conducted during the Holocaust and on African Americans (section 13.6).
12.3 Writing effective questions and questionnaires
Learning Objectives
Learners will be able to…
- Describe some of the ways that survey questions might confuse respondents and how to word questions and responses clearly
- Create mutually exclusive, exhaustive, and balanced response options
- Define fence-sitting and floating
- Describe the considerations involved in constructing a well-designed questionnaire
- Discuss why pilot testing is important
In the previous section, we reviewed how researchers collect data using surveys. Guided by their sampling approach and research context, researchers should choose the survey approach that provides the most favorable tradeoffs in strengths and challenges. With this information in hand, researchers need to write their questionnaire and revise it before beginning data collection. Each method of delivery requires a questionnaire, but they vary a bit based on how they will be used by the researcher. Since phone surveys are read aloud, researchers will pay more attention to how the questionnaire sounds than how it looks. Online surveys can use advanced tools to require the completion of certain questions, present interactive questions and answers, and otherwise afford greater flexibility in how questionnaires are designed. As you read this section, consider how your method of delivery impacts the type of questionnaire you will design. Because most student projects use paper or online surveys, this section will detail how to construct self-administered questionnaires to minimize the potential for bias and error.

Start with operationalization
The first thing you need to do to write effective survey questions is identify what exactly you wish to know. As silly as it sounds to state what seems so completely obvious, we can’t stress enough how easy it is to forget to include important questions when designing a survey. Begin by looking at your research question and refreshing your memory of the operational definitions you developed for those variables from Chapter 11. You should have a pretty firm grasp of your operational definitions before starting the process of questionnaire design. You may have taken those operational definitions from other researchers’ methods, found established scales and indices for your measures, or created your own questions and answer options.
Exercises
STOP! Make sure you have a complete operational definition for the dependent and independent variables in your research question. A complete operational definition contains the variable being measured, the measure used, and how the researcher interprets the measure. Let’s make sure you have what you need from Chapter 11 to begin writing your questionnaire.
List all of the dependent and independent variables in your research question.
- It’s normal to have one dependent or independent variable. It’s also normal to have more than one of either.
- Make sure that your research question (and this list) contain all of the variables in your hypothesis. Your hypothesis should only include variables from you research question.
For each variable in your list:
- Write out the measure you will use (the specific questions and answers) for each variable.
- If you don’t have questions and answers finalized yet, write a first draft and revise it based on what you read in this section.
- If you are using a measure from another researcher, you should be able to write out all of the questions and answers associated with that measure. If you only have the name of a scale or a few questions, you need to access to the full text and some documentation on how to administer and interpret it before you can finish your questionnaire.
- Describe how you will use each measure draw conclusions about the variable in the operational definition.
- For example, an interpretation might be “there are five 7-point Likert scale questions…point values are added across all five items for each participant…and scores below 10 indicate the participant has low self-esteem”
- Don’t introduce other variables into the mix here. All we are concerned with is how you will measure each variable by itself. The connection between variables is done using statistical tests, not operational definitions.
- Detail any validity or reliability issues uncovered by previous researchers using the same measures. If you have concerns about validity and reliability, note them, as well.
If you completed the exercise above and listed out all of the questions and answer choices you will use to measure the variables in your research question, you have already produced a pretty solid first draft of your questionnaire! Congrats! In essence, questionnaires are all of the self-report measures in your operational definitions for the independent, dependent, and control variables in your study arranged into one document and administered to participants. There are a few questions on a questionnaire (like name or ID#) that are not associated with the measurement of variables. These are the exception, and it’s useful to think of a questionnaire as a list of measures for variables. Of course, researchers often use more than one measure of a variable (i.e., triangulation) so they can more confidently assert that their findings are true. A questionnaire should contain all of the measures researchers plan to collect about their variables by asking participants to self-report. As we will discuss in the final section of this chapter, triangulating across data sources (e.g., measuring variables using client files or student records) can avoid some of the common sources of bias in survey research.
Sticking close to your operational definitions is important because it helps you avoid an everything-but-the-kitchen-sink approach that includes every possible question that occurs to you. Doing so puts an unnecessary burden on your survey respondents. Remember that you have asked your participants to give you their time and attention and to take care in responding to your questions; show them your respect by only asking questions that you actually plan to use in your analysis. For each question in your questionnaire, ask yourself how this question measures a variable in your study. An operational definition should contain the questions, response options, and how the researcher will draw conclusions about the variable based on participants’ responses.
Writing questions
So, almost all of the questions on a questionnaire are measuring some variable. For many variables, researchers will create their own questions rather than using one from another researcher. This section will provide some tips on how to create good questions to accurately measure variables in your study. First, questions should be as clear and to the point as possible. This is not the time to show off your creative writing skills; a survey is a technical instrument and should be written in a way that is as direct and concise as possible. As I’ve mentioned earlier, your survey respondents have agreed to give their time and attention to your survey. The best way to show your appreciation for their time is to not waste it. Ensuring that your questions are clear and concise will go a long way toward showing your respondents the gratitude they deserve. Pilot testing the questionnaire with friends or colleagues can help identify these issues. This process is commonly called pretesting, but to avoid any confusion with pretesting in experimental design, we refer to it as pilot testing.
Related to the point about not wasting respondents’ time, make sure that every question you pose will be relevant to every person you ask to complete it. This means two things: first, that respondents have knowledge about whatever topic you are asking them about, and second, that respondents have experienced the events, behaviors, or feelings you are asking them to report. If you are asking participants for second-hand knowledge—asking clinicians about clients’ feelings, asking teachers about students’ feelings, and so forth—you may want to clarify that the variable you are asking about is the key informant’s perception of what is happening in the target population. A well-planned sampling approach ensures that participants are the most knowledgeable population to complete your survey.
If you decide that you do wish to include questions about matters with which only a portion of respondents will have had experience, make sure you know why you are doing so. For example, if you are asking about MSW student study patterns, and you decide to include a question on studying for the social work licensing exam, you may only have a small subset of participants who have begun studying for the graduate exam or took the bachelor’s-level exam. If you decide to include this question that speaks to a minority of participants’ experiences, think about why you are including it. Are you interested in how studying for class and studying for licensure differ? Are you trying to triangulate study skills measures? Researchers should carefully consider whether questions relevant to only a subset of participants is likely to produce enough valid responses for quantitative analysis.
Many times, questions that are relevant to a subsample of participants are conditional on an answer to a previous question. A participant might select that they rent their home, and as a result, you might ask whether they carry renter’s insurance. That question is not relevant to homeowners, so it would be wise not to ask them to respond to it. In that case, the question of whether someone rents or owns their home is a filter question, designed to identify some subset of survey respondents who are asked additional questions that are not relevant to the entire sample. Figure 12.1 presents an example of how to accomplish this on a paper survey by adding instructions to the participant that indicate what question to proceed to next based on their response to the first one. Using online survey tools, researchers can use filter questions to only present relevant questions to participants.
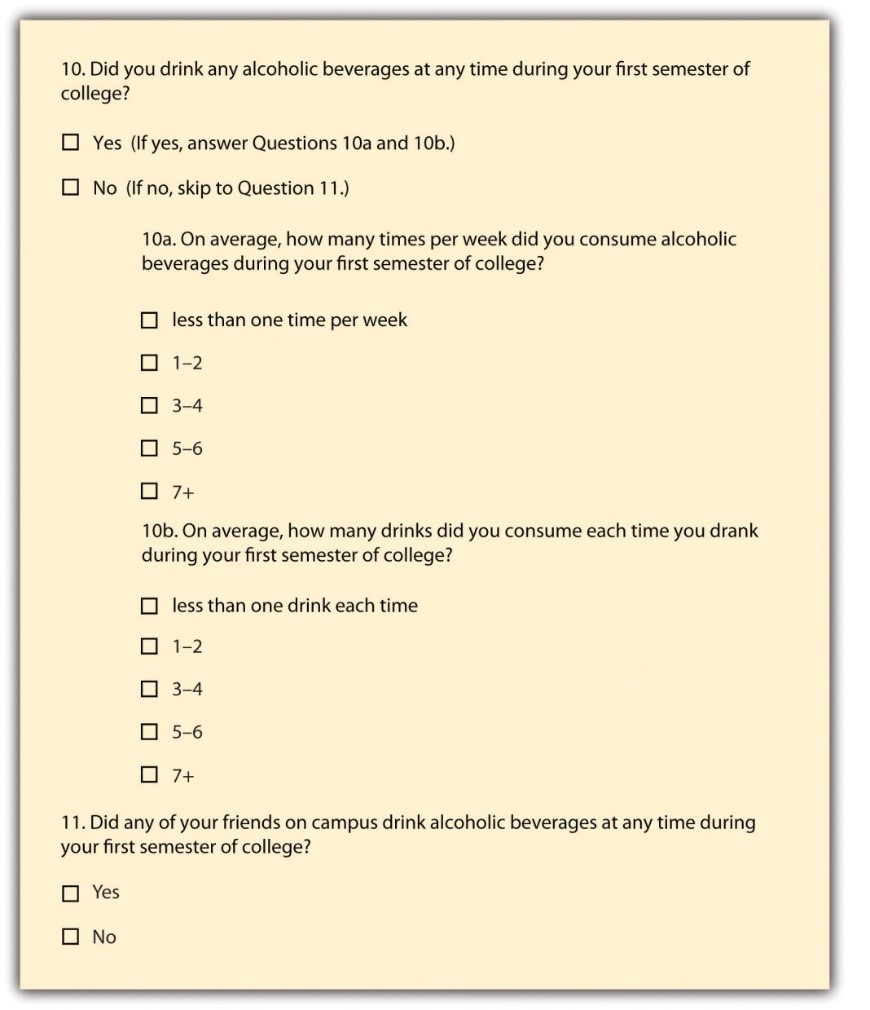
Researchers should eliminate questions that ask about things participants don’t know to minimize confusion. Assuming the question is relevant to the participant, other sources of confusion come from how the question is worded. The use of negative wording can be a source of potential confusion. Taking the question from Figure 12.1 about drinking as our example, what if we had instead asked, “Did you not abstain from drinking during your first semester of college?” This is a double negative, and it’s not clear how to answer the question accurately. It is a good idea to avoid negative phrasing, when possible. For example, “did you not drink alcohol during your first semester of college?” is less clear than “did you drink alcohol your first semester of college?”
You should also avoid using terms or phrases that may be regionally or culturally specific (unless you are absolutely certain all your respondents come from the region or culture whose terms you are using). When I first moved to southwest Virginia, I didn’t know what a holler was. Where I grew up in New Jersey, to holler means to yell. Even then, in New Jersey, we shouted and screamed, but we didn’t holler much. In southwest Virginia, my home at the time, a holler also means a small valley in between the mountains. If I used holler in that way on my survey, people who live near me may understand, but almost everyone else would be totally confused. A similar issue arises when you use jargon, or technical language, that people do not commonly know. For example, if you asked adolescents how they experience imaginary audience, they would find it difficult to link those words to the concepts from David Elkind’s theory. The words you use in your questions must be understandable to your participants. If you find yourself using jargon or slang, break it down into terms that are more universal and easier to understand.
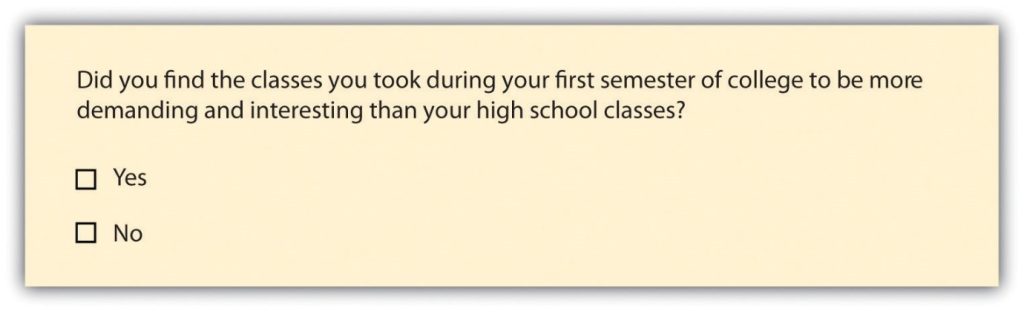
Asking multiple questions as though they are a single question can also confuse survey respondents. There’s a specific term for this sort of question; it is called a double-barreled question. Figure 12.2 shows a double-barreled question. Do you see what makes the question double-barreled? How would someone respond if they felt their college classes were more demanding but also more boring than their high school classes? Or less demanding but more interesting? Because the question combines “demanding” and “interesting,” there is no way to respond yes to one criterion but no to the other.
Another thing to avoid when constructing survey questions is the problem of social desirability. We all want to look good, right? And we all probably know the politically correct response to a variety of questions whether we agree with the politically correct response or not. In survey research, social desirability refers to the idea that respondents will try to answer questions in a way that will present them in a favorable light. (You may recall we covered social desirability bias in Chapter 11.)
Perhaps we decide that to understand the transition to college, we need to know whether respondents ever cheated on an exam in high school or college for our research project. We all know that cheating on exams is generally frowned upon (at least I hope we all know this). So, it may be difficult to get people to admit to cheating on a survey. But if you can guarantee respondents’ confidentiality, or even better, their anonymity, chances are much better that they will be honest about having engaged in this socially undesirable behavior. Another way to avoid problems of social desirability is to try to phrase difficult questions in the most benign way possible. Earl Babbie (2010) [1] offers a useful suggestion for helping you do this—simply imagine how you would feel responding to your survey questions. If you would be uncomfortable, chances are others would as well.
Exercises
Try to step outside your role as researcher for a second, and imagine you were one of your participants. Evaluate the following:
- Is the question too general? Sometimes, questions that are too general may not accurately convey respondents’ perceptions. If you asked someone how they liked a certain book and provide a response scale ranging from “not at all” to “extremely well”, and if that person selected “extremely well,” what do they mean? Instead, ask more specific behavioral questions, such as “Will you recommend this book to others?” or “Do you plan to read other books by the same author?”
- Is the question too detailed? Avoid unnecessarily detailed questions that serve no specific research purpose. For instance, do you need the age of each child in a household or is just the number of children in the household acceptable? However, if unsure, it is better to err on the side of details than generality.
- Is the question presumptuous? Does your question make assumptions? For instance, if you ask, “what do you think the benefits of a tax cut would be?” you are presuming that the participant sees the tax cut as beneficial. But many people may not view tax cuts as beneficial. Some might see tax cuts as a precursor to less funding for public schools and fewer public services such as police, ambulance, and fire department. Avoid questions with built-in presumptions.
- Does the question ask the participant to imagine something? Is the question imaginary? A popular question on many television game shows is “if you won a million dollars on this show, how will you plan to spend it?” Most participants have never been faced with this large amount of money and have never thought about this scenario. In fact, most don’t even know that after taxes, the value of the million dollars will be greatly reduced. In addition, some game shows spread the amount over a 20-year period. Without understanding this “imaginary” situation, participants may not have the background information necessary to provide a meaningful response.
Finally, it is important to get feedback on your survey questions from as many people as possible, especially people who are like those in your sample. Now is not the time to be shy. Ask your friends for help, ask your mentors for feedback, ask your family to take a look at your survey as well. The more feedback you can get on your survey questions, the better the chances that you will come up with a set of questions that are understandable to a wide variety of people and, most importantly, to those in your sample.
In sum, in order to pose effective survey questions, researchers should do the following:
- Identify how each question measures an independent, dependent, or control variable in their study.
- Keep questions clear and succinct.
- Make sure respondents have relevant lived experience to provide informed answers to your questions.
- Use filter questions to avoid getting answers from uninformed participants.
- Avoid questions that are likely to confuse respondents—including those that use double negatives, use culturally specific terms or jargon, and pose more than one question at a time.
- Imagine how respondents would feel responding to questions.
- Get feedback, especially from people who resemble those in the researcher’s sample.
Exercises
Let’s complete a first draft of your questions. In the previous exercise, you listed all of the questions and answers you will use to measure the variables in your research question.
- In the previous exercise, you wrote out the questions and answers for each measure of your independent and dependent variables. Evaluate each question using the criteria listed above on effective survey questions.
- Type out questions for your control variables and evaluate them, as well. Consider what response options you want to offer participants.
Now, let’s revise any questions that do not meet your standards!
- Use the BRUSO model in Table 12.2 for an illustration of how to address deficits in question wording. Keep in mind that you are writing a first draft in this exercise, and it will take a few drafts and revisions before your questions are ready to distribute to participants.
| Criterion | Poor | Effective |
| B- Brief | “Are you now or have you ever been the possessor of a firearm?” | Have you ever possessed a firearm? |
| R- Relevant | “Who did you vote for in the last election?” | Note: Only include items that are relevant to your study. |
| U- Unambiguous | “Are you a gun person?” | Do you currently own a gun?” |
| S- Specific | How much have you read about the new gun control measure and sales tax?” | “How much have you read about the new sales tax on firearm purchases?” |
| O- Objective | “How much do you support the beneficial new gun control measure?” | “What is your view of the new gun control measure?” |

Writing response options
While posing clear and understandable questions in your survey is certainly important, so too is providing respondents with unambiguous response options. Response options are the answers that you provide to the people completing your questionnaire. Generally, respondents will be asked to choose a single (or best) response to each question you pose. We call questions in which the researcher provides all of the response options closed-ended questions. Keep in mind, closed-ended questions can also instruct respondents to choose multiple response options, rank response options against one another, or assign a percentage to each response option. But be cautious when experimenting with different response options! Accepting multiple responses to a single question may add complexity when it comes to quantitatively analyzing and interpreting your data.
Surveys need not be limited to closed-ended questions. Sometimes survey researchers include open-ended questions in their survey instruments as a way to gather additional details from respondents. An open-ended question does not include response options; instead, respondents are asked to reply to the question in their own way, using their own words. These questions are generally used to find out more about a survey participant’s experiences or feelings about whatever they are being asked to report in the survey. If, for example, a survey includes closed-ended questions asking respondents to report on their involvement in extracurricular activities during college, an open-ended question could ask respondents why they participated in those activities or what they gained from their participation. While responses to such questions may also be captured using a closed-ended format, allowing participants to share some of their responses in their own words can make the experience of completing the survey more satisfying to respondents and can also reveal new motivations or explanations that had not occurred to the researcher. This is particularly important for mixed-methods research. It is possible to analyze open-ended response options quantitatively using content analysis (i.e., counting how often a theme is represented in a transcript looking for statistical patterns). However, for most researchers, qualitative data analysis will be needed to analyze open-ended questions, and researchers need to think through how they will analyze any open-ended questions as part of their data analysis plan. We will address qualitative data analysis in greater detail in Chapter 19.
To keep things simple, we encourage you to use only closed-ended response options in your study. While open-ended questions are not wrong, they are often a sign in our classrooms that students have not thought through all the way how to operationally define and measure their key variables. Open-ended questions cannot be operationally defined because you don’t know what responses you will get. Instead, you will need to analyze the qualitative data using one of the techniques we discuss in Chapter 19 to interpret your participants’ responses.
To write an effective response options for closed-ended questions, there are a couple of guidelines worth following. First, be sure that your response options are mutually exclusive. Look back at Figure 12.1, which contains questions about how often and how many drinks respondents consumed. Do you notice that there are no overlapping categories in the response options for these questions? This is another one of those points about question construction that seems fairly obvious but that can be easily overlooked. Response options should also be exhaustive. In other words, every possible response should be covered in the set of response options that you provide. For example, note that in question 10a in Figure 12.1, we have covered all possibilities—those who drank, say, an average of once per month can choose the first response option (“less than one time per week”) while those who drank multiple times a day each day of the week can choose the last response option (“7+”). All the possibilities in between these two extremes are covered by the middle three response options, and every respondent fits into one of the response options we provided.
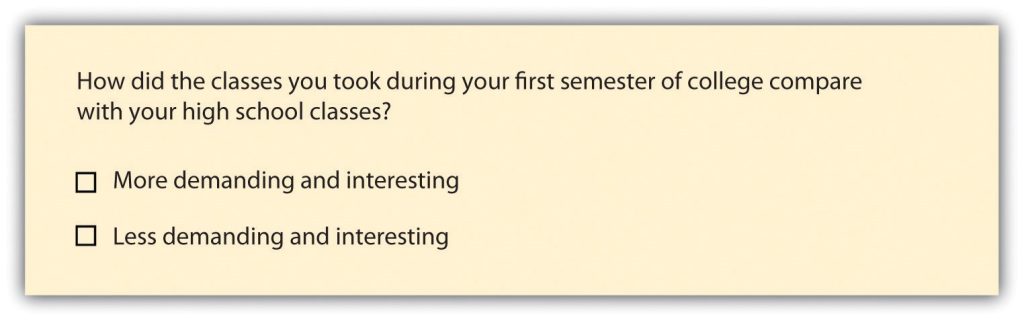
Earlier in this section, we discussed double-barreled questions. Response options can also be double barreled, and this should be avoided. Figure 12.3 is an example of a question that uses double-barreled response options. Other tips about questions are also relevant to response options, including that participants should be knowledgeable enough to select or decline a response option as well as avoiding jargon and cultural idioms.
Even if you phrase questions and response options clearly, participants are influenced by how many response options are presented on the questionnaire. For Likert scales, five or seven response options generally allow about as much precision as respondents are capable of. However, numerical scales with more options can sometimes be appropriate. For dimensions such as attractiveness, pain, and likelihood, a 0-to-10 scale will be familiar to many respondents and easy for them to use. Regardless of the number of response options, the most extreme ones should generally be “balanced” around a neutral or modal midpoint. An example of an unbalanced rating scale measuring perceived likelihood might look like this:
Unlikely | Somewhat Likely | Likely | Very Likely | Extremely Likely
Because we have four rankings of likely and only one ranking of unlikely, the scale is unbalanced and most responses will be biased toward “likely” rather than “unlikely.” A balanced version might look like this:
Extremely Unlikely | Somewhat Unlikely | As Likely as Not | Somewhat Likely |Extremely Likely
In this example, the midpoint is halfway between likely and unlikely. Of course, a middle or neutral response option does not have to be included. Researchers sometimes choose to leave it out because they want to encourage respondents to think more deeply about their response and not simply choose the middle option by default. Fence-sitters are respondents who choose neutral response options, even if they have an opinion. Some people will be drawn to respond, “no opinion” even if they have an opinion, particularly if their true opinion is the not a socially desirable opinion. Floaters, on the other hand, are those that choose a substantive answer to a question when really, they don’t understand the question or don’t have an opinion.
As you can see, floating is the flip side of fence-sitting. Thus, the solution to one problem is often the cause of the other. How you decide which approach to take depends on the goals of your research. Sometimes researchers specifically want to learn something about people who claim to have no opinion. In this case, allowing for fence-sitting would be necessary. Other times researchers feel confident their respondents will all be familiar with every topic in their survey. In this case, perhaps it is okay to force respondents to choose one side or another (e.g., agree or disagree) without a middle option (e.g., neither agree nor disagree) or to not include an option like “don’t know enough to say” or “not applicable.” There is no always-correct solution to either problem. But in general, including middle option in a response set provides a more exhaustive set of response options than one that excludes one.
The most important check before your finalize your response options is to align them with your operational definitions. As we’ve discussed before, your operational definitions include your measures (questions and responses options) as well as how to interpret those measures in terms of the variable being measured. In particular, you should be able to interpret all response options to a question based on your operational definition of the variable it measures. If you wanted to measure the variable “social class,” you might ask one question about a participant’s annual income and another about family size. Your operational definition would need to provide clear instructions on how to interpret response options. Your operational definition is basically like this social class calculator from Pew Research, though they include a few more questions in their definition.
To drill down a bit more, as Pew specifies in the section titled “how the income calculator works,” the interval/ratio data respondents enter is interpreted using a formula combining a participant’s four responses to the questions posed by Pew categorizing their household into three categories—upper, middle, or lower class. So, the operational definition includes the four questions comprising the measure and the formula or interpretation which converts responses into the three final categories that we are familiar with: lower, middle, and upper class.
It is interesting to note that even though participants inis an ordinal level of measurement. Whereas, Pew asks four questions that use an interval or ratio level of measurement (depending on the question). This means that respondents provide numerical responses, rather than choosing categories like lower, middle, and upper class. It’s perfectly normal for operational definitions to change levels of measurement, and it’s also perfectly normal for the level of measurement to stay the same. The important thing is that each response option a participant can provide is accounted for by the operational definition. Throw any combination of family size, location, or income at the Pew calculator, and it will define you into one of those three social class categories.
Unlike Pew’s definition, the operational definitions in your study may not need their own webpage to define and describe. For many questions and answers, interpreting response options is easy. If you were measuring “income” instead of “social class,” you could simply operationalize the term by asking people to list their total household income before taxes are taken out. Higher values indicate higher income, and lower values indicate lower income. Easy. Regardless of whether your operational definitions are simple or more complex, every response option to every question on your survey (with a few exceptions) should be interpretable using an operational definition of a variable. Just like we want to avoid an everything-but-the-kitchen-sink approach to questions on our questionnaire, you want to make sure your final questionnaire only contains response options that you will use in your study.
One note of caution on interpretation (sorry for repeating this). We want to remind you again that an operational definition should not mention more than one variable. In our example above, your operational definition could not say “a family of three making under $50,000 is lower class; therefore, they are more likely to experience food insecurity.” That last clause about food insecurity may well be true, but it’s not a part of the operational definition for social class. Each variable (food insecurity and class) should have its own operational definition. If you are talking about how to interpret the relationship between two variables, you are talking about your data analysis plan. We will discuss how to create your data analysis plan beginning in Chapter 14. For now, one consideration is that depending on the statistical test you use to test relationships between variables, you may need nominal, ordinal, or interval/ratio data. Your questions and response options should match the level of measurement you need with the requirements of the specific statistical tests in your data analysis plan. Once you finalize your data analysis plan, return to your questionnaire to match the level of measurement matches with the statistical test you’ve chosen.
In summary, to write effective response options researchers should do the following:
- Avoid wording that is likely to confuse respondents—including double negatives, use culturally specific terms or jargon, and double-barreled response options.
- Ensure response options are relevant to participants’ knowledge and experience so they can make an informed and accurate choice.
- Present mutually exclusive and exhaustive response options.
- Consider fence-sitters and floaters, and the use of neutral or “not applicable” response options.
- Define how response options are interpreted as part of an operational definition of a variable.
- Check level of measurement matches operational definitions and the statistical tests in the data analysis plan (once you develop one in the future)
Exercises
Look back at the response options you drafted in the previous exercise. Make sure you have a first draft of response options for each closed-ended question on your questionnaire.
- Using the criteria above, evaluate the wording of the response options for each question on your questionnaire.
- Revise your questions and response options until you have a complete first draft.
- Do your first read-through and provide a dummy answer to each question. Make sure you can link each response option and each question to an operational definition.
- Look ahead to Chapter 14 and consider how each item on your questionnaire will inform your data analysis plan.
From this discussion, we hope it is clear why researchers using quantitative methods spell out all of their plans ahead of time. Ultimately, there should be a straight line from operational definition through measures on your questionnaire to the data analysis plan. If your questionnaire includes response options that are not aligned with operational definitions or not included in the data analysis plan, the responses you receive back from participants won’t fit with your conceptualization of the key variables in your study. If you do not fix these errors and proceed with collecting unstructured data, you will lose out on many of the benefits of survey research and face overwhelming challenges in answering your research question.

Designing questionnaires
Based on your work in the previous section, you should have a first draft of the questions and response options for the key variables in your study. Now, you’ll also need to think about how to present your written questions and response options to survey respondents. It’s time to write a final draft of your questionnaire and make it look nice. Designing questionnaires takes some thought. First, consider the route of administration for your survey. What we cover in this section will apply equally to paper and online surveys, but if you are planning to use online survey software, you should watch tutorial videos and explore the features of of the survey software you will use.
Informed consent & instructions
Writing effective items is only one part of constructing a survey. For one thing, every survey should have a written or spoken introduction that serves two basic functions (Peterson, 2000).[2] One is to encourage respondents to participate in the survey. In many types of research, such encouragement is not necessary either because participants do not know they are in a study (as in naturalistic observation) or because they are part of a subject pool and have already shown their willingness to participate by signing up and showing up for the study. Survey research usually catches respondents by surprise when they answer their phone, go to their mailbox, or check their e-mail—and the researcher must make a good case for why they should agree to participate. Thus, the introduction should briefly explain the purpose of the survey and its importance, provide information about the sponsor of the survey (university-based surveys tend to generate higher response rates), acknowledge the importance of the respondent’s participation, and describe any incentives for participating.
The second function of the introduction is to establish informed consent. Remember that this involves describing to respondents everything that might affect their decision to participate. This includes the topics covered by the survey, the amount of time it is likely to take, the respondent’s option to withdraw at any time, confidentiality issues, and other ethical considerations we covered in Chapter 6. Written consent forms are not always used in survey research (when the research is of minimal risk and completion of the survey instrument is often accepted by the IRB as evidence of consent to participate), so it is important that this part of the introduction be well documented and presented clearly and in its entirety to every respondent.
Organizing items to be easy and intuitive to follow
The introduction should be followed by the substantive questionnaire items. But first, it is important to present clear instructions for completing the questionnaire, including examples of how to use any unusual response scales. Remember that the introduction is the point at which respondents are usually most interested and least fatigued, so it is good practice to start with the most important items for purposes of the research and proceed to less important items. Items should also be grouped by topic or by type. For example, items using the same rating scale (e.g., a 5-point agreement scale) should be grouped together if possible to make things faster and easier for respondents. Demographic items are often presented last because they are least interesting to participants but also easy to answer in the event respondents have become tired or bored. Of course, any survey should end with an expression of appreciation to the respondent.
Questions are often organized thematically. If our survey were measuring social class, perhaps we’d have a few questions asking about employment, others focused on education, and still others on housing and community resources. Those may be the themes around which we organize our questions. Or perhaps it would make more sense to present any questions we had about parents’ income and then present a series of questions about estimated future income. Grouping by theme is one way to be deliberate about how you present your questions. Keep in mind that you are surveying people, and these people will be trying to follow the logic in your questionnaire. Jumping from topic to topic can give people a bit of whiplash and may make participants less likely to complete it.
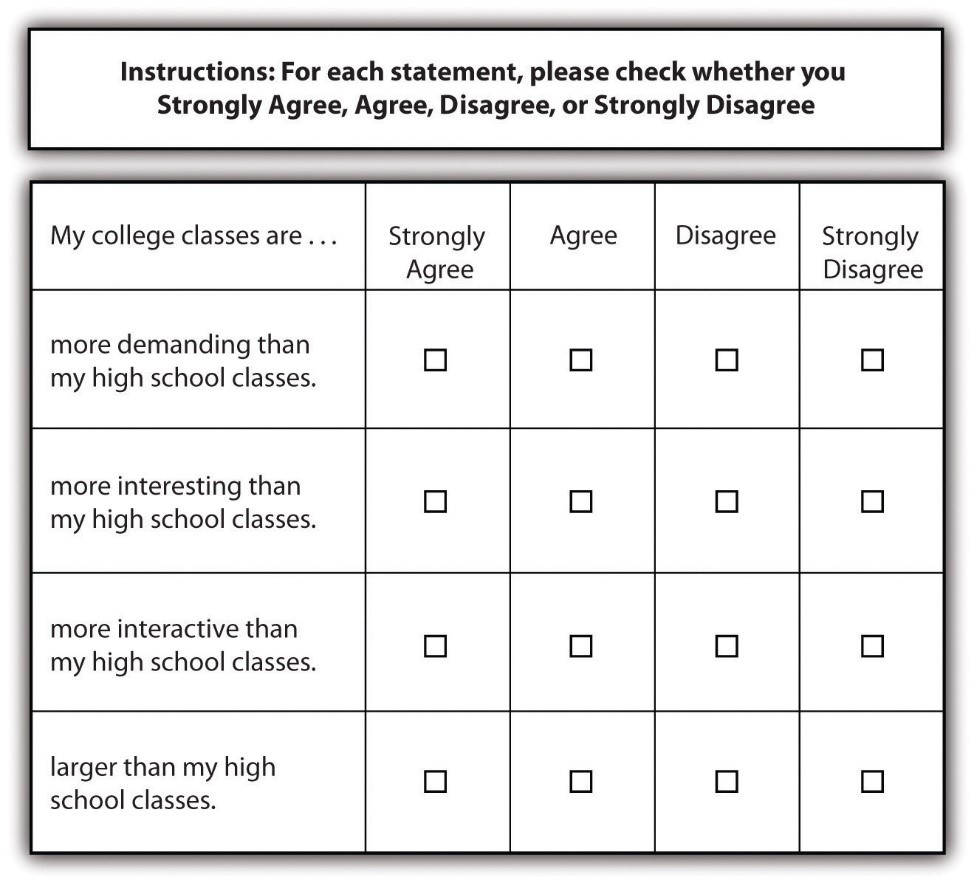
Using a matrix is a nice way of streamlining response options for similar questions. A matrix is a question type that that lists a set of questions for which the answer categories are all the same. If you have a set of questions for which the response options are the same, it may make sense to create a matrix rather than posing each question and its response options individually. Not only will this save you some space in your survey but it will also help respondents progress through your survey more easily. A sample matrix can be seen in Figure 12.4.
Once you have grouped similar questions together, you’ll need to think about the order in which to present those question groups. Most survey researchers agree that it is best to begin a survey with questions that will want to make respondents continue (Babbie, 2010; Dillman, 2000; Neuman, 2003).[3] In other words, don’t bore respondents, but don’t scare them away either. There’s some disagreement over where on a survey to place demographic questions, such as those about a person’s age, gender, and race. On the one hand, placing them at the beginning of the questionnaire may lead respondents to think the survey is boring, unimportant, and not something they want to bother completing. On the other hand, if your survey deals with some very sensitive topic, such as child sexual abuse or criminal convictions, you don’t want to scare respondents away or shock them by beginning with your most intrusive questions.
Your participants are human. They will react emotionally to questionnaire items, and they will also try to uncover your research questions and hypotheses. In truth, the order in which you present questions on a survey is best determined by the unique characteristics of your research. When feasible, you should consult with key informants from your target population determine how best to order your questions. If it is not feasible to do so, think about the unique characteristics of your topic, your questions, and most importantly, your sample. Keeping in mind the characteristics and needs of the people you will ask to complete your survey should help guide you as you determine the most appropriate order in which to present your questions. None of your decisions will be perfect, and all studies have limitations.
Questionnaire length
You’ll also need to consider the time it will take respondents to complete your questionnaire. Surveys vary in length, from just a page or two to a dozen or more pages, which means they also vary in the time it takes to complete them. How long to make your survey depends on several factors. First, what is it that you wish to know? Wanting to understand how grades vary by gender and year in school certainly requires fewer questions than wanting to know how people’s experiences in college are shaped by demographic characteristics, college attended, housing situation, family background, college major, friendship networks, and extracurricular activities. Keep in mind that even if your research question requires a sizable number of questions be included in your questionnaire, do your best to keep the questionnaire as brief as possible. Any hint that you’ve thrown in a bunch of useless questions just for the sake of it will turn off respondents and may make them not want to complete your survey.
Second, and perhaps more important, how long are respondents likely to be willing to spend completing your questionnaire? If you are studying college students, asking them to use their very free time to complete your survey may mean they won’t want to spend more than a few minutes on it. But if you find ask them to complete your survey during down-time between classes and there is little work to be done, students may be willing to give you a bit more of their time. Think about places and times that your sampling frame naturally gathers and whether you would be able to either recruit participants or distribute a survey in that context. Estimate how long your participants would reasonably have to complete a survey presented to them during this time. The more you know about your population (such as what weeks have less work and more free time), the better you can target questionnaire length.
The time that survey researchers ask respondents to spend on questionnaires varies greatly. Some researchers advise that surveys should not take longer than about 15 minutes to complete (as cited in Babbie 2010),[4] whereas others suggest that up to 20 minutes is acceptable (Hopper, 2010).[5] As with question order, there is no clear-cut, always-correct answer about questionnaire length. The unique characteristics of your study and your sample should be considered to determine how long to make your questionnaire. For example, if you planned to distribute your questionnaire to students in between classes, you will need to make sure it is short enough to complete before the next class begins.
When designing a questionnaire, a researcher should consider:
- Weighing strengths and limitations of the method of delivery, including the advanced tools in online survey software or the simplicity of paper questionnaires.
- Grouping together items that ask about the same thing.
- Moving any questions about sensitive items to the end of the questionnaire, so as not to scare respondents off.
- Moving any questions that engage the respondent to answer the questionnaire at the beginning, so as not to bore them.
- Timing the length of the questionnaire with a reasonable length of time you can ask of your participants.
- Dedicating time to visual design and ensure the questionnaire looks professional.
Exercises
Type out a final draft of your questionnaire in a word processor or online survey tool.
- Evaluate your questionnaire using the guidelines above, revise it, and get it ready to share with other student researchers.

Pilot testing and revising questionnaires
A good way to estimate the time it will take respondents to complete your questionnaire (and other potential challenges) is through pilot testing. Pilot testing allows you to get feedback on your questionnaire so you can improve it before you actually administer it. It can be quite expensive and time consuming if you wish to pilot test your questionnaire on a large sample of people who very much resemble the sample to whom you will eventually administer the finalized version of your questionnaire. But you can learn a lot and make great improvements to your questionnaire simply by pilot testing with a small number of people to whom you have easy access (perhaps you have a few friends who owe you a favor). By pilot testing your questionnaire, you can find out how understandable your questions are, get feedback on question wording and order, find out whether any of your questions are boring or offensive, and learn whether there are places where you should have included filter questions. You can also time pilot testers as they take your survey. This will give you a good idea about the estimate to provide respondents when you administer your survey and whether you have some wiggle room to add additional items or need to cut a few items.
Perhaps this goes without saying, but your questionnaire should also have an attractive design. A messy presentation style can confuse respondents or, at the very least, annoy them. Be brief, to the point, and as clear as possible. Avoid cramming too much into a single page. Make your font size readable (at least 12 point or larger, depending on the characteristics of your sample), leave a reasonable amount of space between items, and make sure all instructions are exceptionally clear. If you are using an online survey, ensure that participants can complete it via mobile, computer, and tablet devices. Think about books, documents, articles, or web pages that you have read yourself—which were relatively easy to read and easy on the eyes and why? Try to mimic those features in the presentation of your survey questions. While online survey tools automate much of visual design, word processors are designed for writing all kinds of documents and may need more manual adjustment as part of visual design.
Realistically, your questionnaire will continue to evolve as you develop your data analysis plan over the next few chapters. By now, you should have a complete draft of your questionnaire grounded in an underlying logic that ties together each question and response option to a variable in your study. Once your questionnaire is finalized, you will need to submit it for ethical approval from your professor or the IRB. If your study requires IRB approval, it may be worthwhile to submit your proposal before your questionnaire is completely done. Revisions to IRB protocols are common and it takes less time to review a few changes to questions and answers than it does to review the entire study, so give them the whole study as soon as you can. Once the IRB approves your questionnaire, you cannot change it without their okay.
Key Takeaways
- A questionnaire is comprised of self-report measures of variables in a research study.
- Make sure your survey questions will be relevant to all respondents and that you use filter questions when necessary.
- Effective survey questions and responses take careful construction by researchers, as participants may be confused or otherwise influenced by how items are phrased.
- The questionnaire should start with informed consent and instructions, flow logically from one topic to the next, engage but not shock participants, and thank participants at the end.
- Pilot testing can help identify any issues in a questionnaire before distributing it to participants, including language or length issues.
Exercises
It’s a myth that researchers work alone! Get together with a few of your fellow students and swap questionnaires for pilot testing.
- Use the criteria in each section above (questions, response options, questionnaires) and provide your peers with the strengths and weaknesses of their questionnaires.
- See if you can guess their research question and hypothesis based on the questionnaire alone.
13.2 What is an experiment and when should you use one?
Learning Objectives
Learners will be able to…
- Identify the characteristics of a basic experiment
- Describe causality in experimental design
- Discuss the relationship between dependent and independent variables in experiments
- Explain the links between experiments and generalizability of results
- Describe advantages and disadvantages of experimental designs
The basics of experiments
The first experiment I can remember using was for my fourth grade science fair. I wondered if latex- or oil-based paint would hold up to sunlight better. So, I went to the hardware store and got a few small cans of paint and two sets of wooden paint sticks. I painted one with oil-based paint and the other with latex-based paint of different colors and put them in a sunny spot in the back yard. My hypothesis was that the oil-based paint would fade the most and that more fading would happen the longer I left the paint sticks out. (I know, it’s obvious, but I was only 10.)
I checked in on the paint sticks every few days for a month and wrote down my observations. The first part of my hypothesis ended up being wrong—it was actually the latex-based paint that faded the most. But the second part was right, and the paint faded more and more over time. This is a simple example, of course—experiments get a heck of a lot more complex than this when we’re talking about real research.
Merriam-Webster defines an experiment as “an operation or procedure carried out under controlled conditions in order to discover an unknown effect or law, to test or establish a hypothesis, or to illustrate a known law.” Each of these three components of the definition will come in handy as we go through the different types of experimental design in this chapter. Most of us probably think of the physical sciences when we think of experiments, and for good reason—these experiments can be pretty flashy! But social science and psychological research follow the same scientific methods, as we’ve discussed in this book.
As the video discusses, experiments can be used in social sciences just like they can in physical sciences. It makes sense to use an experiment when you want to determine the cause of a phenomenon with as much accuracy as possible. Some types of experimental designs do this more precisely than others, as we’ll see throughout the chapter. If you’ll remember back to Chapter 11 and the discussion of validity, experiments are the best way to ensure internal validity, or the extent to which a change in your independent variable causes a change in your dependent variable.
Experimental designs for research projects are most appropriate when trying to uncover or test a hypothesis about the cause of a phenomenon, so they are best for explanatory research questions. As we’ll learn throughout this chapter, different circumstances are appropriate for different types of experimental designs. Each type of experimental design has advantages and disadvantages, and some are better at controlling the effect of extraneous variables—those variables and characteristics that have an effect on your dependent variable, but aren’t the primary variable whose influence you’re interested in testing. For example, in a study that tries to determine whether aspirin lowers a person’s risk of a fatal heart attack, a person’s race would likely be an extraneous variable because you primarily want to know the effect of aspirin.
In practice, many types of experimental designs can be logistically challenging and resource-intensive. As practitioners, the likelihood that we will be involved in some of the types of experimental designs discussed in this chapter is fairly low. However, it’s important to learn about these methods, even if we might not ever use them, so that we can be thoughtful consumers of research that uses experimental designs.
While we might not use all of these types of experimental designs, many of us will engage in evidence-based practice during our time as social workers. A lot of research developing evidence-based practice, which has a strong emphasis on generalizability, will use experimental designs. You’ve undoubtedly seen one or two in your literature search so far.
The logic of experimental design
How do we know that one phenomenon causes another? The complexity of the social world in which we practice and conduct research means that causes of social problems are rarely cut and dry. Uncovering explanations for social problems is key to helping clients address them, and experimental research designs are one road to finding answers.
As you read about in Chapter 8 (and as we’ll discuss again in Chapter 15), just because two phenomena are related in some way doesn’t mean that one causes the other. Ice cream sales increase in the summer, and so does the rate of violent crime; does that mean that eating ice cream is going to make me murder someone? Obviously not, because ice cream is great. The reality of that relationship is far more complex—it could be that hot weather makes people more irritable and, at times, violent, while also making people want ice cream. More likely, though, there are other social factors not accounted for in the way we just described this relationship.
Experimental designs can help clear up at least some of this fog by allowing researchers to isolate the effect of interventions on dependent variables by controlling extraneous variables. In true experimental design (discussed in the next section) and some quasi-experimental designs, researchers accomplish this with the control group and the experimental group. (The experimental group is sometimes called the “treatment group,” but we will call it the experimental group in this chapter.) The control group does not receive the intervention you are testing (they may receive no intervention or what is known as “treatment as usual”), while the experimental group does. (You will hopefully remember our earlier discussion of control variables in Chapter 8—conceptually, the use of the word “control” here is the same.)

In a well-designed experiment, your control group should look almost identical to your experimental group in terms of demographics and other relevant factors. What if we want to know the effect of CBT on social anxiety, but we have learned in prior research that men tend to have a more difficult time overcoming social anxiety? We would want our control and experimental groups to have a similar gender mix because it would limit the effect of gender on our results, since ostensibly, both groups’ results would be affected by gender in the same way. If your control group has 5 women, 6 men, and 4 non-binary people, then your experimental group should be made up of roughly the same gender balance to help control for the influence of gender on the outcome of your intervention. (In reality, the groups should be similar along other dimensions, as well, and your group will likely be much larger.) The researcher will use the same outcome measures for both groups and compare them, and assuming the experiment was designed correctly, get a pretty good answer about whether the intervention had an effect on social anxiety.
You will also hear people talk about comparison groups, which are similar to control groups. The primary difference between the two is that a control group is populated using random assignment, but a comparison group is not. Random assignment entails using a random process to decide which participants are put into the control or experimental group (which participants receive an intervention and which do not). By randomly assigning participants to a group, you can reduce the effect of extraneous variables on your research because there won’t be a systematic difference between the groups.
Do not confuse random assignment with random sampling. Random sampling is a method for selecting a sample from a population, and is rarely used in psychological research. Random assignment is a method for assigning participants in a sample to the different conditions, and it is an important element of all experimental research in psychology and other related fields. Random sampling also helps a great deal with generalizability, whereas random assignment increases internal validity.
We have already learned about internal validity in Chapter 11. The use of an experimental design will bolster internal validity since it works to isolate causal relationships. As we will see in the coming sections, some types of experimental design do this more effectively than others. It’s also worth considering that true experiments, which most effectively show causality, are often difficult and expensive to implement. Although other experimental designs aren’t perfect, they still produce useful, valid evidence and may be more feasible to carry out.
Key Takeaways
- Experimental designs are useful for establishing causality, but some types of experimental design do this better than others.
- Experiments help researchers isolate the effect of the independent variable on the dependent variable by controlling for the effect of extraneous variables.
- Experiments use a control/comparison group and an experimental group to test the effects of interventions. These groups should be as similar to each other as possible in terms of demographics and other relevant factors.
- True experiments have control groups with randomly assigned participants, while other types of experiments have comparison groups to which participants are not randomly assigned.
Exercises
- Think about the research project you’ve been designing so far. How might you use a basic experiment to answer your question? If your question isn’t explanatory, try to formulate a new explanatory question and consider the usefulness of an experiment.
- Why is establishing a simple relationship between two variables not indicative of one causing the other?
13.2 True experimental design
Learning Objectives
Learners will be able to…
- Describe a true experimental design in social work research
- Understand the different types of true experimental designs
- Determine what kinds of research questions true experimental designs are suited for
- Discuss advantages and disadvantages of true experimental designs
True experimental design, often considered to be the “gold standard” in research designs, is thought of as one of the most rigorous of all research designs. We have also termed it a randomized controlled trial. Those two terms describe the same design. In this design, one or more independent variables are manipulated by the researcher (as treatments), subjects are randomly assigned to different treatment levels (random assignment), and the results of the treatments on outcomes (dependent variables) are observed. The unique strength of experimental research is its internal validity and its ability to establish (causality) through treatment manipulation, while controlling for the effects of extraneous variable. Sometimes the treatment level is no treatment, while other times it is simply a different treatment than that which we are trying to evaluate. For example, we might have a control group that is made up of people who will not receive any treatment for a particular condition. Or, a control group could consist of people who consent to treatment with DBT when we are testing the effectiveness of CBT.
As we discussed in the previous section, a true experiment has a control group with participants randomly assigned, and an experimental group. This is the most basic element of a true experiment. The next decision a researcher must make is when they need to gather data during their experiment. Do they take a baseline measurement and then a measurement after treatment, or just a measurement after treatment, or do they handle measurement another way? Below, we’ll discuss the three main types of true experimental designs. There are sub-types of each of these designs, but here, we just want to get you started with some of the basics.
Using a true experiment in social work research is often pretty difficult, since as I mentioned earlier, true experiments can be quite resource intensive. True experiments work best with relatively large sample sizes, and random assignment, a key criterion for a true experimental design, is hard (and unethical) to execute in practice when you have people in dire need of an intervention. Nonetheless, some of the strongest evidence bases are built on true experiments.
For the purposes of this section, let’s bring back the example of CBT for the treatment of social anxiety. We have a group of 500 individuals who have agreed to participate in our study, and we have randomly assigned them to the control and experimental groups. The folks in the experimental group will receive CBT, while the folks in the control group will receive more unstructured, basic talk therapy. These designs, as we talked about above, are best suited for explanatory research questions.
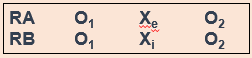
Before we get started, take a look at the table below. When explaining experimental research designs, we often use diagrams with abbreviations to visually represent the experiment. Table 13.1 starts us off by laying out what each of the abbreviations mean.
| R | Randomly assigned group (control/comparison or experimental) |
| O | Observation/measurement taken of dependent variable |
| X | Intervention or treatment |
| Xe | Experimental or new intervention |
| Xi | Typical intervention/treatment as usual |
| A, B, C, etc. | Denotes different groups (control/comparison and experimental) |
Pretest and post-test control group design
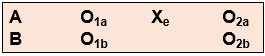
In pretest and post-test control group design, participants are given a pretest of some kind to measure their baseline state before their participation in an intervention. In our social anxiety experiment, we would have participants in both the experimental and control groups complete some measure of social anxiety—most likely an established scale and/or a structured interview—before they start their treatment. As part of the experiment, we would have a defined time period during which the treatment would take place (let’s say 12 weeks, just for illustration). At the end of 12 weeks, we would give both groups the same measure as a post-test.
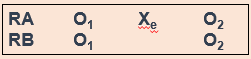
In the diagram, RA (random assignment group A) is the experimental group and RB is the control group. O1 denotes the pre-test, Xe denotes the experimental intervention, and O2 denotes the post-test. Let’s look at this diagram another way, using the example of CBT for social anxiety that we’ve been talking about.

In a situation where the control group received treatment as usual instead of no intervention, the diagram would look this way, with Xi denoting treatment as usual (Figure 13.3).
Hopefully, these diagrams provide you a visualization of how this type of experiment establishes time order, a key component of a causal relationship. Did the change occur after the intervention? Assuming there is a change in the scores between the pretest and post-test, we would be able to say that yes, the change did occur after the intervention. Causality can’t exist if the change happened before the intervention—this would mean that something else led to the change, not our intervention.
Post-test only control group design
Post-test only control group design involves only giving participants a post-test, just like it sounds (Figure 13.4).
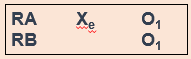
But why would you use this design instead of using a pretest/post-test design? One reason could be the testing effect that can happen when research participants take a pretest. In research, the testing effect refers to “measurement error related to how a test is given; the conditions of the testing, including environmental conditions; and acclimation to the test itself” (Engel & Schutt, 2017, p. 444)[6] (When we say “measurement error,” all we mean is the accuracy of the way we measure the dependent variable.) Figure 13.4 is a visualization of this type of experiment. The testing effect isn’t always bad in practice—our initial assessments might help clients identify or put into words feelings or experiences they are having when they haven’t been able to do that before. In research, however, we might want to control its effects to isolate a cleaner causal relationship between intervention and outcome.
Going back to our CBT for social anxiety example, we might be concerned that participants would learn about social anxiety symptoms by virtue of taking a pretest. They might then identify that they have those symptoms on the post-test, even though they are not new symptoms for them. That could make our intervention look less effective than it actually is.
However, without a baseline measurement establishing causality can be more difficult. If we don’t know someone’s state of mind before our intervention, how do we know our intervention did anything at all? Establishing time order is thus a little more difficult. You must balance this consideration with the benefits of this type of design.
Solomon four group design
One way we can possibly measure how much the testing effect might change the results of the experiment is with the Solomon four group design. Basically, as part of this experiment, you have two control groups and two experimental groups. The first pair of groups receives both a pretest and a post-test. The other pair of groups receives only a post-test (Figure 13.5). This design helps address the problem of establishing time order in post-test only control group designs.
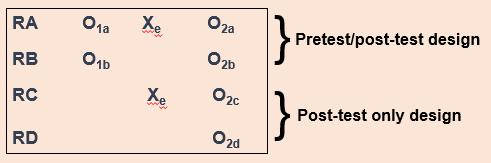
For our CBT project, we would randomly assign people to four different groups instead of just two. Groups A and B would take our pretest measures and our post-test measures, and groups C and D would take only our post-test measures. We could then compare the results among these groups and see if they’re significantly different between the folks in A and B, and C and D. If they are, we may have identified some kind of testing effect, which enables us to put our results into full context. We don’t want to draw a strong causal conclusion about our intervention when we have major concerns about testing effects without trying to determine the extent of those effects.
Solomon four group designs are less common in social work research, primarily because of the logistics and resource needs involved. Nonetheless, this is an important experimental design to consider when we want to address major concerns about testing effects.
Key Takeaways
- True experimental design is best suited for explanatory research questions.
- True experiments require random assignment of participants to control and experimental groups.
- Pretest/post-test research design involves two points of measurement—one pre-intervention and one post-intervention.
- Post-test only research design involves only one point of measurement—post-intervention. It is a useful design to minimize the effect of testing effects on our results.
- Solomon four group research design involves both of the above types of designs, using 2 pairs of control and experimental groups. One group receives both a pretest and a post-test, while the other receives only a post-test. This can help uncover the influence of testing effects.
Exercises
- Think about a true experiment you might conduct for your research project. Which design would be best for your research, and why?
- What challenges or limitations might make it unrealistic (or at least very complicated!) for you to carry your true experimental design in the real-world as a student researcher?
- What hypothesis(es) would you test using this true experiment?
13.4 Quasi-experimental designs
Learning Objectives
Learners will be able to…
- Describe a quasi-experimental design in social work research
- Understand the different types of quasi-experimental designs
- Determine what kinds of research questions quasi-experimental designs are suited for
- Discuss advantages and disadvantages of quasi-experimental designs
Quasi-experimental designs are a lot more common in social work research than true experimental designs. Although quasi-experiments don’t do as good a job of giving us robust proof of causality, they still allow us to establish time order, which is a key element of causality. The prefix quasi means “resembling,” so quasi-experimental research is research that resembles experimental research, but is not true experimental research. Nonetheless, given proper research design, quasi-experiments can still provide extremely rigorous and useful results.
There are a few key differences between true experimental and quasi-experimental research. The primary difference between quasi-experimental research and true experimental research is that quasi-experimental research does not involve random assignment to control and experimental groups. Instead, we talk about comparison groups in quasi-experimental research instead. As a result, these types of experiments don’t control the effect of extraneous variables as well as a true experiment.
Quasi-experiments are most likely to be conducted in field settings in which random assignment is difficult or impossible. They are often conducted to evaluate the effectiveness of a treatment—perhaps a type of psychotherapy or an educational intervention. We’re able to eliminate some threats to internal validity, but we can’t do this as effectively as we can with a true experiment. Realistically, our CBT-social anxiety project is likely to be a quasi experiment, based on the resources and participant pool we’re likely to have available.
It’s important to note that not all quasi-experimental designs have a comparison group. There are many different kinds of quasi-experiments, but we will discuss the three main types below: nonequivalent comparison group designs, time series designs, and ex post facto comparison group designs.
Nonequivalent comparison group design
You will notice that this type of design looks extremely similar to the pretest/post-test design that we discussed in section 13.3. But instead of random assignment to control and experimental groups, researchers use other methods to construct their comparison and experimental groups. A diagram of this design will also look very similar to pretest/post-test design, but you’ll notice we’ve removed the “R” from our groups, since they are not randomly assigned (Figure 13.6).
Researchers using this design select a comparison group that’s as close as possible based on relevant factors to their experimental group. Engel and Schutt (2017)[7] identify two different selection methods:
- Individual matching: Researchers take the time to match individual cases in the experimental group to similar cases in the comparison group. It can be difficult, however, to match participants on all the variables you want to control for.
- Aggregate matching: Instead of trying to match individual participants to each other, researchers try to match the population profile of the comparison and experimental groups. For example, researchers would try to match the groups on average age, gender balance, or median income. This is a less resource-intensive matching method, but researchers have to ensure that participants aren’t choosing which group (comparison or experimental) they are a part of.
As we’ve already talked about, this kind of design provides weaker evidence that the intervention itself leads to a change in outcome. Nonetheless, we are still able to establish time order using this method, and can thereby show an association between the intervention and the outcome. Like true experimental designs, this type of quasi-experimental design is useful for explanatory research questions.
What might this look like in a practice setting? Let’s say you’re working at an agency that provides CBT and other types of interventions, and you have identified a group of clients who are seeking help for social anxiety, as in our earlier example. Once you’ve obtained consent from your clients, you can create a comparison group using one of the matching methods we just discussed. If the group is small, you might match using individual matching, but if it’s larger, you’ll probably sort people by demographics to try to get similar population profiles. (You can do aggregate matching more easily when your agency has some kind of electronic records or database, but it’s still possible to do manually.)
Time series design
Another type of quasi-experimental design is a time series design. Unlike other types of experimental design, time series designs do not have a comparison group. A time series is a set of measurements taken at intervals over a period of time (Figure 13.7). Proper time series design should include at least three pre- and post-intervention measurement points. While there are a few types of time series designs, we’re going to focus on the most common: interrupted time series design.

But why use this method? Here’s an example. Let’s think about elementary student behavior throughout the school year. As anyone with children or who is a teacher knows, kids get very excited and animated around holidays, days off, or even just on a Friday afternoon. This fact might mean that around those times of year, there are more reports of disruptive behavior in classrooms. What if we took our one and only measurement in mid-December? It’s possible we’d see a higher-than-average rate of disruptive behavior reports, which could bias our results if our next measurement is around a time of year students are in a different, less excitable frame of mind. When we take multiple measurements throughout the first half of the school year, we can establish a more accurate baseline for the rate of these reports by looking at the trend over time.
We may want to test the effect of extended recess times in elementary school on reports of disruptive behavior in classrooms. When students come back after the winter break, the school extends recess by 10 minutes each day (the intervention), and the researchers start tracking the monthly reports of disruptive behavior again. These reports could be subject to the same fluctuations as the pre-intervention reports, and so we once again take multiple measurements over time to try to control for those fluctuations.
This method improves the extent to which we can establish causality because we are accounting for a major extraneous variable in the equation—the passage of time. On its own, it does not allow us to account for other extraneous variables, but it does establish time order and association between the intervention and the trend in reports of disruptive behavior. Finding a stable condition before the treatment that changes after the treatment is evidence for causality between treatment and outcome.
Ex post facto comparison group design
Ex post facto (Latin for “after the fact”) designs are extremely similar to nonequivalent comparison group designs. There are still comparison and experimental groups, pretest and post-test measurements, and an intervention. But in ex post facto designs, participants are assigned to the comparison and experimental groups once the intervention has already happened. This type of design often occurs when interventions are already up and running at an agency and the agency wants to assess effectiveness based on people who have already completed treatment.
In most clinical agency environments, social workers conduct both initial and exit assessments, so there are usually some kind of pretest and post-test measures available. We also typically collect demographic information about our clients, which could allow us to try to use some kind of matching to construct comparison and experimental groups.
In terms of internal validity and establishing causality, ex post facto designs are a bit of a mixed bag. The ability to establish causality depends partially on the ability to construct comparison and experimental groups that are demographically similar so we can control for these extraneous variables.
Conclusion
Quasi-experimental designs are common in social work intervention research because, when designed correctly, they balance the intense resource needs of true experiments with the realities of research in practice. They still offer researchers tools to gather robust evidence about whether interventions are having positive effects for clients.
Key Takeaways
- Quasi-experimental designs are similar to true experiments, but do not require random assignment to experimental and control groups.
- In quasi-experimental projects, the group not receiving the treatment is called the comparison group, not the control group.
- Nonequivalent comparison group design is nearly identical to pretest/post-test experimental design, but participants are not randomly assigned to the experimental and control groups. As a result, this design provides slightly less robust evidence for causality.
- Nonequivalent groups can be constructed by individual matching or aggregate matching.
- Time series design does not have a control or experimental group, and instead compares the condition of participants before and after the intervention by measuring relevant factors at multiple points in time. This allows researchers to mitigate the error introduced by the passage of time.
- Ex post facto comparison group designs are also similar to true experiments, but experimental and comparison groups are constructed after the intervention is over. This makes it more difficult to control for the effect of extraneous variables, but still provides useful evidence for causality because it maintains the time order of the experiment.
Exercises
- Think back to the experiment you considered for your research project in Section 13.3. Now that you know more about quasi-experimental designs, do you still think it’s a true experiment? Why or why not?
- What should you consider when deciding whether an experimental or quasi-experimental design would be more feasible or fit your research question better?
13.5 Non-experimental designs
Learning Objectives
Learners will be able to…
- Describe non-experimental designs in social work research
- Discuss how non-experimental research differs from true and quasi-experimental research
- Demonstrate an understanding the different types of non-experimental designs
- Determine what kinds of research questions non-experimental designs are suited for
- Discuss advantages and disadvantages of non-experimental designs
The previous sections have laid out the basics of some rigorous approaches to establish that an intervention is responsible for changes we observe in research participants. This type of evidence is extremely important to build an evidence base for social work interventions, but it’s not the only type of evidence to consider. We will discuss qualitative methods, which provide us with rich, contextual information, in Part 4 of this text. The designs we’ll talk about in this section are sometimes used in qualitative research, but in keeping with our discussion of experimental design so far, we’re going to stay in the quantitative research realm for now. Non-experimental is also often a stepping stone for more rigorous experimental design in the future, as it can help test the feasibility of your research.
In general, non-experimental designs do not strongly support causality and don’t address threats to internal validity. However, that’s not really what they’re intended for. Non-experimental designs are useful for a few different types of research, including explanatory questions in program evaluation. Certain types of non-experimental design are also helpful for researchers when they are trying to develop a new assessment or scale. Other times, researchers or agency staff did not get a chance to gather any assessment information before an intervention began, so a pretest/post-test design is not possible.

A significant benefit of these types of designs is that they’re pretty easy to execute in a practice or agency setting. They don’t require a comparison or control group, and as Engel and Schutt (2017)[8] point out, they “flow from a typical practice model of assessment, intervention, and evaluating the impact of the intervention” (p. 177). Thus, these designs are fairly intuitive for social workers, even when they aren’t expert researchers. Below, we will go into some detail about the different types of non-experimental design.
One group pretest/post-test design
Also known as a before-after one-group design, this type of research design does not have a comparison group and everyone who participates in the research receives the intervention (Figure 13.8). This is a common type of design in program evaluation in the practice world. Controlling for extraneous variables is difficult or impossible in this design, but given that it is still possible to establish some measure of time order, it does provide weak support for causality.
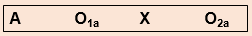
Imagine, for example, a researcher who is interested in the effectiveness of an anti-drug education program on elementary school students’ attitudes toward illegal drugs. The researcher could assess students’ attitudes about illegal drugs (O1), implement the anti-drug program (X), and then immediately after the program ends, the researcher could once again measure students’ attitudes toward illegal drugs (O2). You can see how this would be relatively simple to do in practice, and have probably been involved in this type of research design yourself, even if informally. But hopefully, you can also see that this design would not provide us with much evidence for causality because we have no way of controlling for the effect of extraneous variables. A lot of things could have affected any change in students’ attitudes—maybe girls already had different attitudes about illegal drugs than children of other genders, and when we look at the class’s results as a whole, we couldn’t account for that influence using this design.
All of that doesn’t mean these results aren’t useful, however. If we find that children’s attitudes didn’t change at all after the drug education program, then we need to think seriously about how to make it more effective or whether we should be using it at all. (This immediate, practical application of our results highlights a key difference between program evaluation and research, which we will discuss in Chapter 23.)
After-only design
As the name suggests, this type of non-experimental design involves measurement only after an intervention. There is no comparison or control group, and everyone receives the intervention. I have seen this design repeatedly in my time as a program evaluation consultant for nonprofit organizations, because often these organizations realize too late that they would like to or need to have some sort of measure of what effect their programs are having.
Because there is no pretest and no comparison group, this design is not useful for supporting causality since we can’t establish the time order and we can’t control for extraneous variables. However, that doesn’t mean it’s not useful at all! Sometimes, agencies need to gather information about how their programs are functioning. A classic example of this design is satisfaction surveys—realistically, these can only be administered after a program or intervention. Questions regarding satisfaction, ease of use or engagement, or other questions that don’t involve comparisons are best suited for this type of design.
Static-group design
A final type of non-experimental research is the static-group design. In this type of research, there are both comparison and experimental groups, which are not randomly assigned. There is no pretest, only a post-test, and the comparison group has to be constructed by the researcher. Sometimes, researchers will use matching techniques to construct the groups, but often, the groups are constructed by convenience of who is being served at the agency.
Conclusion
Non-experimental research designs are easy to execute in practice, but we must be cautious about drawing causal conclusions from the results. A positive result may still suggest that we should continue using a particular intervention (and no result or a negative result should make us reconsider whether we should use that intervention at all). You have likely seen non-experimental research in your daily life or at your agency, and knowing the basics of how to structure such a project will help you ensure you are providing clients with the best care possible.
Key Takeaways
- Non-experimental designs are useful for describing phenomena, but cannot demonstrate causality.
- After-only designs are often used in agency and practice settings because practitioners are often not able to set up pre-test/post-test designs.
- Non-experimental designs are useful for explanatory questions in program evaluation and are helpful for researchers when they are trying to develop a new assessment or scale.
- Non-experimental designs are well-suited to qualitative methods.
Exercises
- If you were to use a non-experimental design for your research project, which would you choose? Why?
- Have you conducted non-experimental research in your practice or professional life? Which type of non-experimental design was it?
13.6 Critical, ethical, and cultural considerations
Learning Objectives
Learners will be able to…
- Describe critiques of experimental design
- Identify ethical issues in the design and execution of experiments
- Identify cultural considerations in experimental design
As I said at the outset, experiments, and especially true experiments, have long been seen as the gold standard to gather scientific evidence. When it comes to research in the biomedical field and other physical sciences, true experiments are subject to far less nuance than experiments in the social world. This doesn’t mean they are easier—just subject to different forces. However, as a society, we have placed the most value on quantitative evidence obtained through empirical observation and especially experimentation.
Major critiques of experimental designs tend to focus on true experiments, especially randomized controlled trials (RCTs), but many of these critiques can be applied to quasi-experimental designs, too. Some researchers, even in the biomedical sciences, question the view that RCTs are inherently superior to other types of quantitative research designs. RCTs are far less flexible and have much more stringent requirements than other types of research. One seemingly small issue, like incorrect information about a research participant, can derail an entire RCT. RCTs also cost a great deal of money to implement and don’t reflect “real world” conditions. The cost of true experimental research or RCTs also means that some communities are unlikely to ever have access to these research methods. It is then easy for people to dismiss their research findings because their methods are seen as “not rigorous.”
Obviously, controlling outside influences is important for researchers to draw strong conclusions, but what if those outside influences are actually important for how an intervention works? Are we missing really important information by focusing solely on control in our research? Is a treatment going to work the same for white women as it does for indigenous women? With the myriad effects of our societal structures, you should be very careful ever assuming this will be the case. This doesn’t mean that cultural differences will negate the effect of an intervention; instead, it means that you should remember to practice cultural humility implementing all interventions, even when we “know” they work.
How we build evidence through experimental research reveals a lot about our values and biases, and historically, much experimental research has been conducted on white people, and especially white men.[9] This makes sense when we consider the extent to which the sciences and academia have historically been dominated by white patriarchy. This is especially important for marginalized groups that have long been ignored in research literature, meaning they have also been ignored in the development of interventions and treatments that are accepted as “effective.” There are examples of marginalized groups being experimented on without their consent, like the Tuskegee Experiment or Nazi experiments on Jewish people during World War II. We cannot ignore the collective consciousness situations like this can create about experimental research for marginalized groups.
None of this is to say that experimental research is inherently bad or that you shouldn’t use it. Quite the opposite—use it when you can, because there are a lot of benefits, as we learned throughout this chapter. As a social work researcher, you are uniquely positioned to conduct experimental research while applying social work values and ethics to the process and be a leader for others to conduct research in the same framework. It can conflict with our professional ethics, especially respect for persons and beneficence, if we do not engage in experimental research with our eyes wide open. We also have the benefit of a great deal of practice knowledge that researchers in other fields have not had the opportunity to get. As with all your research, always be sure you are fully exploring the limitations of the research.
Key Takeaways
- While true experimental research gathers strong evidence, it can also be inflexible, expensive, and overly simplistic in terms of important social forces that affect the resources.
- Marginalized communities’ past experiences with experimental research can affect how they respond to research participation.
- Social work researchers should use both their values and ethics, and their practice experiences, to inform research and push other researchers to do the same.
Exercises
- Think back to the true experiment you sketched out in the exercises for Section 13.3. Are there cultural or historical considerations you hadn’t thought of with your participant group? What are they? Does this change the type of experiment you would want to do?
- How can you as a social work researcher encourage researchers in other fields to consider social work ethics and values in their experimental research?
- Babbie, E. (2010). The practice of social research (12th ed.). Belmont, CA: Wadsworth. ↵
- Peterson, R. A. (2000). Constructing effective questionnaires. Thousand Oaks, CA: Sage. ↵
- Babbie, E. (2010). The practice of social research (12th ed.). Belmont, CA: Wadsworth; Dillman, D. A. (2000). Mail and Internet surveys: The tailored design method (2nd ed.). New York, NY: Wiley; Neuman, W. L. (2003). Social research methods: Qualitative and quantitative approaches (5th ed.). Boston, MA: Pearson. ↵
- Babbie, E. (2010). The practice of social research (12th ed.). Belmont, CA: Wadsworth. ↵
- Hopper, J. (2010). How long should a survey be? Retrieved from http://www.verstaresearch.com/blog/how-long-should-a-survey-be ↵
- Engel, R. & Schutt, R. (2016). The practice of research in social work. Thousand Oaks, CA: SAGE Publications, Inc. ↵
- Engel, R. & Schutt, R. (2016). The practice of research in social work. Thousand Oaks, CA: SAGE Publications, Inc. ↵
- Engel, R. & Schutt, R. (2016). The practice of research in social work. Thousand Oaks, CA: SAGE Publications, Inc. ↵
- Sullivan, G. M. (2011). Getting off the “gold standard”: Randomized controlled trials and education research. Journal of Graduate Medical Education, 3(3), 285-289. ↵
Triangulation of data refers to the use of multiple types, measures or sources of data in a research project to increase the confidence that we have in our findings.
Testing out your research materials in advance on people who are not included as participants in your study.
items on a questionnaire designed to identify some subset of survey respondents who are asked additional questions that are not relevant to the entire sample
a question that asks more than one thing at a time, making it difficult to respond accurately
When a participant answers in a way that they believe is socially the most acceptable answer.
the answers researchers provide to participants to choose from when completing a questionnaire
questions in which the researcher provides all of the response options
Questions for which the researcher does not include response options, allowing for respondents to answer the question in their own words
respondents to a survey who choose neutral response options, even if they have an opinion
respondents to a survey who choose a substantive answer to a question when really, they don’t understand the question or don’t have an opinion
An ordered outline that includes your research question, a description of the data you are going to use to answer it, and the exact analyses, step-by-step, that you plan to run to answer your research question.
A process through which the researcher explains the research process, procedures, risks and benefits to a potential participant, usually through a written document, which the participant than signs, as evidence of their agreement to participate.
a type of survey question that lists a set of questions for which the response options are all the same in a grid layout
an operation or procedure carried out under controlled conditions in order to discover an unknown effect or law, to test or establish a hypothesis, or to illustrate a known law.
explains why particular phenomena work in the way that they do; answers “why” questions
variables and characteristics that have an effect on your outcome, but aren't the primary variable whose influence you're interested in testing.
the group of participants in our study who do not receive the intervention we are researching in experiments with random assignment
in experimental design, the group of participants in our study who do receive the intervention we are researching
the group of participants in our study who do not receive the intervention we are researching in experiments without random assignment
using a random process to decide which participants are tested in which conditions
The ability to apply research findings beyond the study sample to some broader population,
Ability to say that one variable "causes" something to happen to another variable. Very important to assess when thinking about studies that examine causation such as experimental or quasi-experimental designs.
the idea that one event, behavior, or belief will result in the occurrence of another, subsequent event, behavior, or belief
An experimental design in which one or more independent variables are manipulated by the researcher (as treatments), subjects are randomly assigned to different treatment levels (random assignment), and the results of the treatments on outcomes (dependent variables) are observed
an experiment that involves random assignment to a control and experimental group to evaluate the impact of an intervention or stimulus
a type of experimental design in which participants are randomly assigned to control and experimental groups, one group receives an intervention, and both groups receive pre- and post-test assessments
A measure of a participant's condition before they receive an intervention or treatment.
A measure of a participant's condition after an intervention or, if they are part of the control/comparison group, at the end of an experiment.
A demonstration that a change occurred after an intervention. An important criterion for establishing causality.
an experimental design in which participants are randomly assigned to control and treatment groups, one group receives an intervention, and both groups receive only a post-test assessment
The measurement error related to how a test is given; the conditions of the testing, including environmental conditions; and acclimation to the test itself
a subtype of experimental design that is similar to a true experiment, but does not have randomly assigned control and treatment groups
In nonequivalent comparison group designs, the process by which researchers match individual cases in the experimental group to similar cases in the comparison group.
In nonequivalent comparison group designs, the process in which researchers match the population profile of the comparison and experimental groups.
a set of measurements taken at intervals over a period of time
The highest level of measurement. Denoted by mutually exclusive categories, a hierarchy (order), values can be added, subtracted, multiplied, and divided, and the presence of an absolute zero.
