
5 Reading empirical studies
Chapter Outline
- Generalizability & transferability of a study’s design (14 minute read)
- Generalizability & transferability of a study’s sample (13 minute read)
- Generalizability & transferability of a study’s results (41 minute read)
- Annotating an empirical journal article (14 minute read)
Content warning: examples in this chapter contain references to domestic violence and details on types of abuse, drug use, poverty, mental health, sexual harassment and details on harassing behaviors, children’s mental health, LGBTQ+ oppression and suicide, obesity, anti-poverty stigma, and psychotic disorders.
5.1 Generalizability & transferability of a study’s design
Learning Objectives
Learners will be able to…
- Define generalizability and transferability.
- Assess the generalizability and transferability to how researchers use the results from empirical research studies to make arguments about what is objectively true.
- Relate both concepts to the hierarchy of evidence and the types of articles in the scholarly literature
Last chapter focused on outlining review articles, why they are important at the start of a literature review, and how to organize information from scholarly literature reviews into fact outlines and topical outlines. As a result of your inquiry, you should have identified hundreds of potentially relevant citations, dozens of which you may cite in your own review. In the final chapter of Part 1, we will discuss how to assemble the facts you have taken from journal articles into a literature review that represents what you think about the topic.
Only a few articles will align with your specific question so highly that you need to read them front-to-back. By looking at high-quality review articles, you have hopefully identified a few empirical articles that are likely to provide important answers to your research question. If you recall from section 3.1, empirical journal articles are those that report the results of quantitative or qualitative data analyzed by the author.
This chapter will instruct you on closely reading an empirical journal article. Before you decide to spend an hour or so marking up a journal article, it’s important to ascertain whether the article is actually worth your time. You will need to put its results in conversation with the broader literature on your topic. In this chapter we discuss two important concepts–generalizability and transferability–and the how social workers can use them to connect one study to the broader literature and social world.
Generalizability vs. transferability
Generalizability asks one question: How well does the sample of people in this study represent everyone with this issue? If you read in a study that 50% of people in the sample experienced depression, does that mean 50% of everyone experiences depression? For a student writing a literature review, this is the most important question to answer. Unfortunately, this information need is placed at the beginning of the research class, before you learned about any of the underlying research methods! Do not fear! This chapter guides you through the broad strokes of how design, methods, and sampling impact generalizability. For now, just focus on the keywords (e.g., random sampling, experiments) and the logic of generalizability. By adhering strictly to best practices in sampling, measurement, and design, researchers can provide you with good evidence for the generalizability of their study’s results. Future chapters will detail how to perform the specific quantitative research methods used to create generalizable study results.
While generalizability asks if a study’s results apply in all cases, transferability asks if a study’s results might be informative in a similar research context. In assessing a study’s transferability, you are making a weaker but compelling argument that the conclusions of one study can be applied to understanding the people, places, and cultures in your research project. Assessing transferability is more subjective than assessing generalizability. You are using your knowledge of your topic area and research methods (which are always improving!) to make a reasonable argument about why a given piece of empirical evidence helps you understand something.
When evaluating the transferability of a research result to your working question, consider the sample, measures, and design. That is, how data was collected from individuals, who those individuals are, and what researchers did with them. You may find that the samples in generalizable studies do not talk about the specific ethnic, cultural, or geographic group that is in your working question. Similarly, studies of traditional interventions for opiate use disorder treatment may not match your working question on moderation management, medication assisted treatment, or cannabis substitution as an intervention for substance use treatment. Evaluating the transferability of designs may help you identify whether the methods the authors used would be similar to those you might use if you were to conduct a study gathering and collecting your own raw data.
Generalizable results may be applicable because they are broadly transferable across situations, and you can be confident in that when they follow the best practices in this textbook for improving generalizability. Generalizability is not the only question worth asking. Just because a study’s sample represents a broader population does not mean it is helpful for making conclusions about your working question. However, there may be aspects of a study that make its results difficult to transfer to your topic area. Use the tools in this chapter to make a reasonable argument about how a study’s results generalize or transfer to the people in your working question.
Generalizability & study design
Most research projects are designed to maximize generalizability. The figure below provides a common approach to assessing empirical evidence. As you move up the pyramid below, you can be more sure that the data contained in each type of journal article generalizes to all people who experience the issue. In Chapter 3, we referred to these as “types of articles,” but they are more accurately different research designs. A research design (a.k.a., study design) is the procedure, measures, and other methods the researcher will use to answer their research question.
Like we discussed in Chapter 3, the study’s design indicates, to some degree, how generalizable its results are, and as a result, the quality of the evidence. Generalizability is key because objective truth is true for everyone, regardless of context. In other words, objective truths generalize beyond the sample of people from whom data were collected to the larger population of people who experience the issue under examination. You can be more confident that information from a systematic review or meta-analysis will generalize than something from a case study of a single person, pilot projects, and other studies that do not seek to establish generalizability.
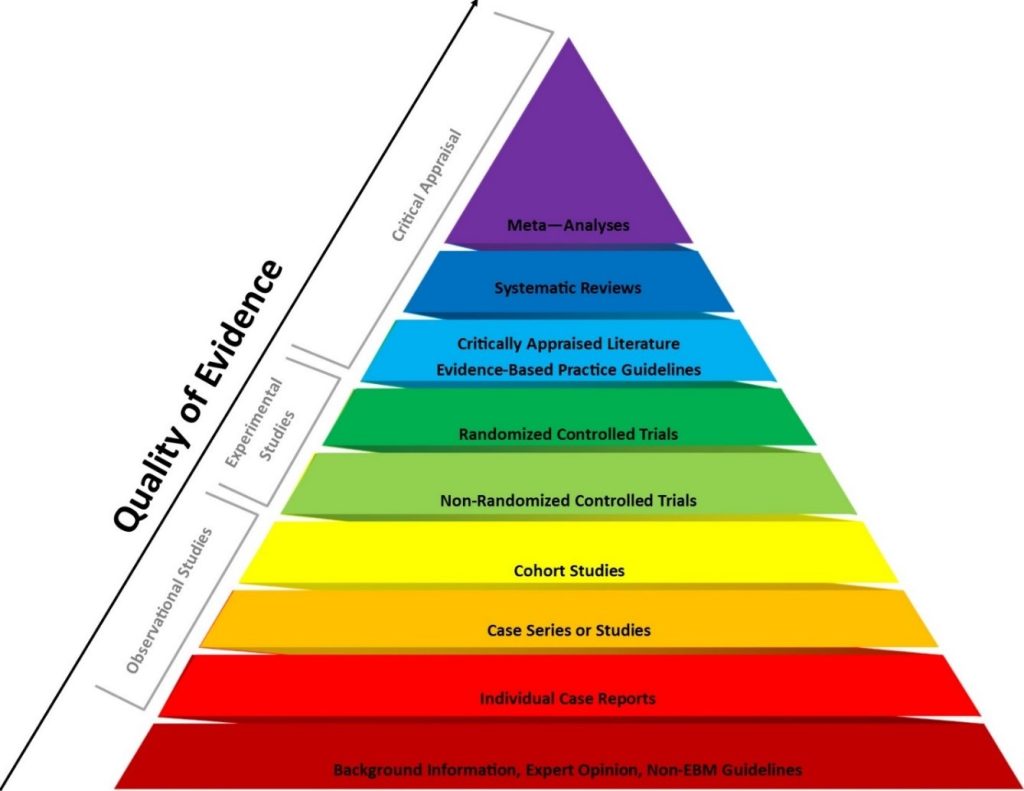
There is one important research method, survey design, that does not appear in this diagram. Because we borrow evidence-based practice from medicine, the pyramid is too focused on intervention research. The pyramid also excludes qualitative research, which is commonly used in social work. Instead of prioritizing generalizability, qualitative researchers aim to be trustworthy and authentic to the words of their study participants, rather than generalizing outward to broader populations. A social work EBP model was advanced by McNeese & Thyer (2004)[1]
- Systematic reviews and meta-analyses
- Randomized controlled trials
- Quasi-experimental studies
- Case-control and cohort studies
- Pre-experimental (or non-experimental) group studies
- Surveys
- Qualitative studies
I find this to be a bit limiting, since there is further variation in the types of studies used by social work researchers. I expanded the hierarchy of evidence to cover a greater breadth of study designs, with those at the top being the most generalizable. While it does not cover all study designs, it provides a more comprehensive overview of how to connect one article with generalizable truth.
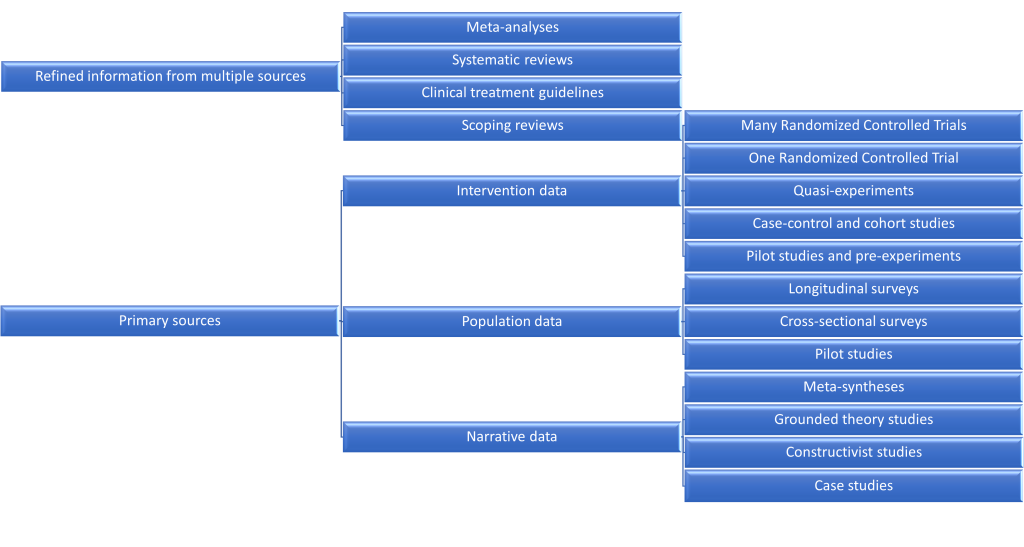
This section will begin by discussing the top of this hierarchy, studies of studies authored by experts in their field. These designs synthesize information from primary sources, often using advanced statistics. You can easily assess the primary sources by the design listed in the abstract or methods section of an empirical journal article. This section will conclude by discussing the bottom of the hierarchy, and how its designs inform transferability.
Meta-research design
To refine scientific information, meta-research uses the scientific method to analyze and improve the scientific production of knowledge. For example, a meta-analysis pulls together samples of people from all high-quality studies on a given topic area creating a super-study with far more people than any single researcher could feasibly collect data from. Because meta-researchers refine data across multiple studies, these represent the most generalizable research findings.
Clinical treatment guidelines translate empirical findings into authoritative opinion pieces from expert panels. While there is no empirical method to their production, they represent authoritative expert opinion and synthesis of research findings. Other meta-research designs that include opinion include narrative reviews and critical reviews. Scoping reviews are also of less depth than systematic reviews. Of course, less stringent literature reviews may include more relevant sources that systematic reviews or meta-analyses exclude.
Not all meta-analyses or systematic reviews are of good quality. As a peer reviewer for a scholarly journal, I have seen poor quality systematic reviews that make methodological mistakes—like not including relevant keywords—that lead to incorrect conclusions. Unfortunately, not all errors are caught in the peer review process, and not all limitations are acknowledged by the authors. Just because you are looking at a systematic review does not mean you are looking at THE OBJECTIVE TRUTH. Nevertheless, you can be pretty sure that results from these studies are generalizable to the population in the study’s research question.
In Figure 5.3 below, you can see how researchers conducting a systematic review identified a large pool of potentially relevant articles, downloaded and analyzed them for relevance, and in the end, analyzed only 71 articles in their systematic review out of a total of 1,589 potentially relevant articles. Because systematic reviews or meta-analyses are intended to make strong, generalizable conclusions, they often exclude studies that still contain good information.
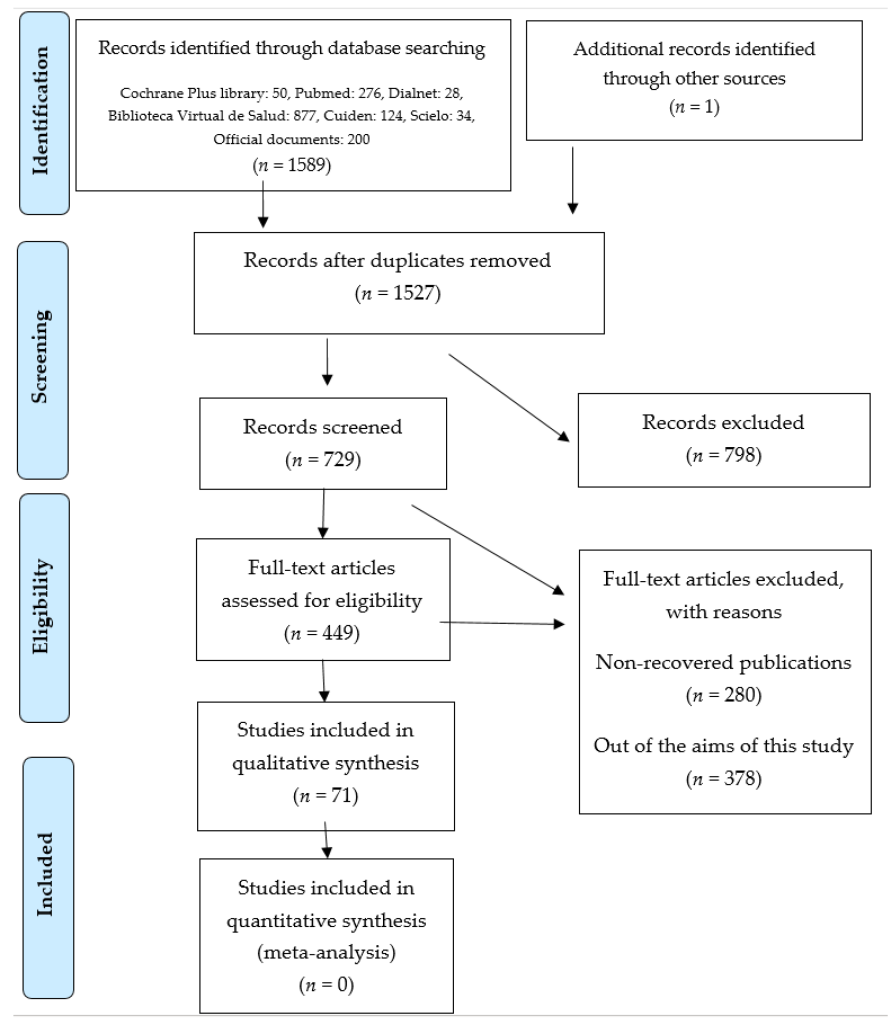
In the process of selecting articles for a meta-analysis and systematic review, researchers may exclude articles with important information because of a minor, but important factor. For example, a study’s intervention or measures may be a bit different than what meta-researchers want to make conclusions about. No meta-research project will perfect encapsulate all of the relevant literature. Meta-research also categorically excludes some sources relevant to your inquiry. By limiting itself to studies published in established journals, meta-research often excludes gray literature, preprints, and studies rejected due to insignificant or null results (i.e., the file drawer phenomenon).
Systematic reviews make tough choices, and meta-analysis authors must make harder choices still. They cannot include a study unless researchers provide data for the authors to include in their meta-analysis. Many authors do not make their data available, and most journals do not require sharing data or methods. This is a key truth applicable across all articles you read—who or what gets selected for analysis in a research project determines how well the project’s results generalize to everyone. We will talk about how sampling impacts generalizability later in this chapter.
Empirical study design
Because refined sources like systematic reviews exclude good studies, they are only a first step in getting to know a topic area. You will need to examine primary sources–the reports of researchers who conducted empirical studies–to make evidence-based conclusions about your topic. Figure 5.2 describes three different types of data and ranks them vertically based on how well you can be sure the information generalizes.
Study design is a good starting point for your inquiry since it only requires you to identify a single keyword which should be included in the abstract and described in detail in the methods section. Over the course of this textbook, you will learn more about how each design is carried out, empowering you to better assess whether a researcher’s design worked as intended to provide a clearer picture of the truth.
Quantitative study designs
As we will discuss further in our chapter on causal explanations, a key factor in scientifically assessing what happened first. Researchers conducting intervention studies are causing change by providing therapy, housing, or whatever the intervention is and measuring the outcomes of that intervention after they happen. For this reason, the results of experiments are considered to be of greater value in arriving at generalizable, objective truth. Because researchers can tightly control the causal variable (a therapy, becoming insured, etc.) we can be somewhat more certain of the conclusions of experiments than surveys.
At the same time, because surveys measure people in their naturalistic environment rather than in a laboratory or artificial setting, they may do a better job at reducing the potential for the researcher to influence the data a participant provides. Surveys also provide descriptive information–like the number of people with a diagnosis or risk factor–that experiments cannot provide. Longitudinal surveys are particularly helpful because they can provide a clearer picture of whether the cause came before the effect in a causal relationship, but because they are expensive and time-consuming to conduct, longitudinal studies are relatively rare in the literature and most surveys measure people at only one point in time (i.e., cross-sectional design).
When assessing the generalizability of a study’s design, look for specific keywords that indicate the researcher used methods that do not generalize well like pilot study, pre-experiment, non-experiment, and exploratory study. When researchers are seeking to perform a pilot study, they are optimizing for time, not generalizability. Their results may still be useful to you! But, you should not generalize from their study to all people with the issue under analysis without additional supporting evidence.
Both experiments and surveys are designed using the same underlying logic. Surveys tightly measure and control for the influence of extraneous factors by use standardized measurements with minimal interference from the researcher. While most surveys measure people only once, limiting causal conclusions, longitudinal surveys allow researchers to tract what caused what over time. Experiments tightly control the laboratory setting, train qualified staff, and for true experiments, randomly assign participants to control groups to isolate the impact of the intervention on client outcomes. Both designs seek to understand the impact of an independent variable, or cause, on a dependent variable, or effect. Researchers aim to generalize the information from surveys and experiments to all people who experience an issue.
Qualitative study designs
Qualitative studies do not try to optimize generalizability. If the results of a qualitative study indicate 10 out of 50 students who participated in the focus group found the mandatory training on harassment to be unhelpful, does that mean 20% of all college students at this university find it unhelpful? No. Focus groups and interviews (and other qualitative methods) are not concerned with generalizability. Instead, focus groups methods optimize for trustworthy and authentic research products. For example, qualitative researchers must make sure all themes and subthemes in their report are traceable to quotes from focus group participants. Instead of providing what is generally true, qualitative research provides a thick description of people’s experiences so you can understand them. Subjective inquiry is less generalizable but provides greater depth in understanding people’s feelings, beliefs, and decision-making processes within their context.
In Figure 5.3, you will note that some qualitative studies are ranked higher than others in terms of generalizability. Meta-syntheses are ranked highest because they are meta-research, pooling together the themes and raw data from multiple qualitative studies into a super-study. A meta-synthesis is the qualitative equivalent of a meta-analysis, which analyzes quantitative data. Because the researchers conducting the meta-syntheses aim to make more broad generalizations across research studies, even though generalizability is not strictly the goal. In a similar way, grounded theory studies (a type of qualitative design) aim to produce a testable hypothesis that could generalize. At the bottom of the hierarchy are individual case studies, which report what happens with a single person, organization, or event. It’s best not to think too long about the generalizability of qualitative results. When examining qualitative articles, you should be examining their internal rigor and transferability to your context. To do that, we must examine the study’s sample in detail, as we discuss in the next section.
Key Takeaways
- Meta-research includes meta-analyses and systematic reviews which apply scientific methods to published research products.
- The design of an empirical study impacts the generalizability of its results.
Exercises
- Select an empirical article highly related to the study you would like to conduct.
- Using the design of the empirical study, assess the generalizability of its research findings.
- Reflect on these questions:
- What are you planning to use this information for?
- Is there a more generalizable source of information?
- Can I use a design as a keyword to find additional information?
5.2 Generalizability & transferability of a study’s sample
Learning Objectives
Learners will be able to…
- Describe how statistical significance and confidence intervals demonstrate which results are most important
- Differentiate between qualitative and quantitative results in an empirical journal article
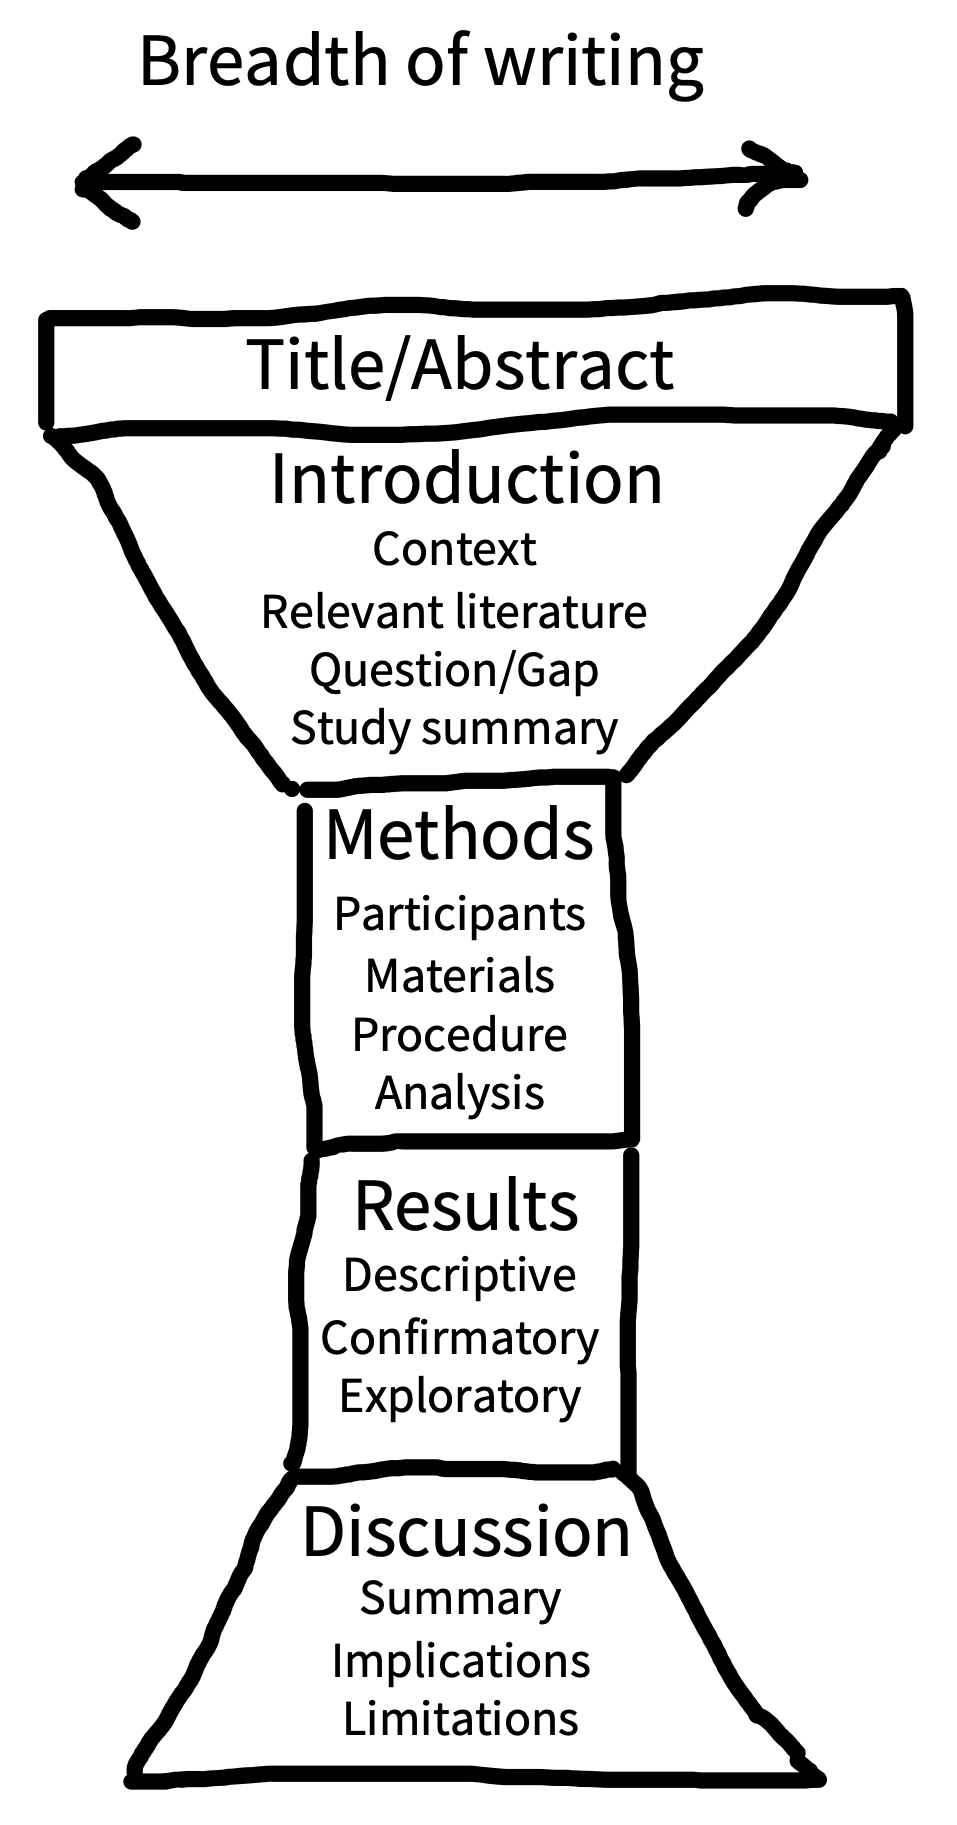
Empirical follow a set structure—introduction, methods, results, discussion, and conclusion. While the headings vary, empirical articles almost always follow the structure in Figure 5.?. The previous section could be completed by just examining the abstract of the journal article, but not we must dive into the more challenging parts of an empirical journal article: the methods.
Structure of an empirical journal article
(adapted from: https://experimentology.io/014-writing.html (CC BY NC))
A scientific paper is not a novel. Rather than reading from beginning to end, readers typically jump between sections to extract information efficiently (Doumont 2009). This “random access” is possible because research articles typically follow the same conventional structure (see figure 14.1). The main body of the article includes four main sections: introduction, methods, results, and discussion (IMRaD). This structure has a narrative logic: What’s the knowledge gap? (introduction); How did you address it? (methods); What did you find? (results); What do the results mean? (discussion).
In the old old days, there were few conventions around scientific communication—scientists would share their latest findings by writing letters to each other. But as the number of scientists and studies increased, this approach became unsustainable. The IMRaD article structure gained traction in the 1800s and became dominant in the mid-1900s when scientific productivity rapidly expanded in the post-war era. We think IMRaD style articles are a big improvement, even if it is nice to receive a letter every now and again.
Structure helps writers as well as readers. Try starting the writing process with section headings as a structure, then flesh out the text, section by section. In each section, start by making a list of the key points you want to convey, each representing the first sentence of a new paragraph. Then add the content of each paragraph, and you’ll be well on your way to having a full first draft of your article.
Imagine that the breadth of focus in the body of your article has an “hourglass” structure (figure 5.?). The start of the introduction should have a broad focus, providing the reader with the general context of your study. From there, the focus of the introduction should get increasingly narrow until you are describing the specific knowledge gap or problem you will address and (briefly) how you are going to address it. The methods and results sections are at the center of the hourglass because they are tightly focused on your study alone. In the discussion section, the focus shifts in the opposite direction, from narrow to broad. Begin by summarizing the results of your study, discuss limitations, then integrate the findings with existing literature and describe practical and theoretical implications.
Read beyond the abstract
At this point, I have read hundreds of literature reviews written by students. One of the challenges I have noted is that students will report the results as summarized in the abstract, rather than the detailed findings laid out in the results section of the article. This poses a problem when you are writing a literature review because you need to provide specific and clear facts that support your reading of the literature.
The abstract may say something like: “we found that poverty is associated with mental health status.” For your literature review, you want the details, not the summary. In the results section of the article, you may find a sentence that states: “children living in households experiencing poverty are three times more likely to have a mental health diagnosis.” This more specific statistical information provides a stronger basis on which to build the arguments in your literature review. You could use that statistic to estimate the impact of a proposed program to address poverty as a mental health risk factor.
If the abstract says something like “we found that poverty is associated with mental health status,” the methods section may add “among a sample of Pakistani graduate students.” Although the general topic may be similar and the study design might match your information need, reading the methods section is necessary to understand the transferability and generalizability of empirical results. Does the target population in your working question have much to do with Pakistani graduate students? If so, keep it! If not, find an article whose sample more closely relates to your information need.
Sampling
(adapted from https://nulib.github.io/moderndive_book/8-populations.html (CC-0))
With quantitative research methods, the goal of empirical analysis is to generalize patterns from this sample to trends in a population. In order to understand the relationship between political party affiliation and voting, for example, you might conduct a poll in a sample of 100 (or 1,000) voters by mail, phone-call, or by stopping them on the street. Or, in order to determine if a new drug effectively reduces the symptoms of obsessive-compulsive disorder, you might conduct a randomized experiment in a sample of 200 patients with OCD. Why not use population data instead? While a census of every person (or unit) in a population would be ideal, it’s pretty obvious why we have to use sampling. The statistics researchers calculate use a smaller sample to estimate an unknowable population parameter.
A sample is a collection of individuals or units (e.g., client files) from a population. A study’s sample is not everyone who could have been in the study, impacted by the study, or even contacted by the study. The sample consists of individuals from whom researchers collected data, or if the study samples documents (e.g., client charts), the documents they sampled. Researchers mathematically denote the sample’s size, the number of people or units we have (or will collect) data on, using lower-case n. If you see that the n=500, there are 500 people in that sample. You will also see n denoting the number of people in a specific subgroup of the sample. We will cover sampling in far greater detail in Chapter 11, so a quick guide will suffice.
Probability
Probability sampling (a.k.a. random sampling) is the act of using a random procedure to select individuals or units from a population that we will collect measurements on. Random sampling is extremely useful because there is no feasible way to extract information from everyone. Here “random” means that every individual or unit in the population has a chance of being selected and this probability is known in advance. For example, a random procedure might involve rolling dice, selecting slips of paper out of a hat, or using a random number generator. Sampling approaches such as simple random sampling, systematic sampling, cluster sampling, and stratified sampling indicate the underlying results may be more generalizable. Look for these keywords to find more generalizable samples.
Non-probability sampling is when researchers use techniques in which the likelihood of being selected for the sample is unknown. Because these techniques introduce extraneous variables into the process (e.g., convenience, researcher’s opinion), they are less useful for providing generalizable truth. Instead, nonprobability techniques are more commonly used for convenience. Quantitative studies that use nonprobability sampling techniques do so for convenience, and indeed, you can search for terms like convenience sample or availability sample. Of course, qualitative research Nonprobability approaches like purposive sampling boost authenticity and trustworthiness in qualitative research studies. Assessing how the author constructed their sample should inform your judgment on transferability to your context.
Linking with design
In the previous section, we discussed how random assignment helps experiments allow you to make causal claims. Figure 5.? below integrates both design and sampling into an integrated framework for judging the generalizability of a study. The ideal experiment would have both random assignment and random sampling so that you could have a casual conclusion that is generalizable to the whole population. Quasi-experiments, pre-experiments, non-experiments, and pilot studies do not include random assignments, and are less likely to provide a generalizable causal conclusion than true experiments. Random assignment prevents researches from biasing the experimental and control conditions. Random sampling prevents researchers biasing the sample during the recruitment process. Although surveys (observational studies, in the figure below) do not use random assignment, they should use random sampling to improve generalizability of findings beyond the sample.
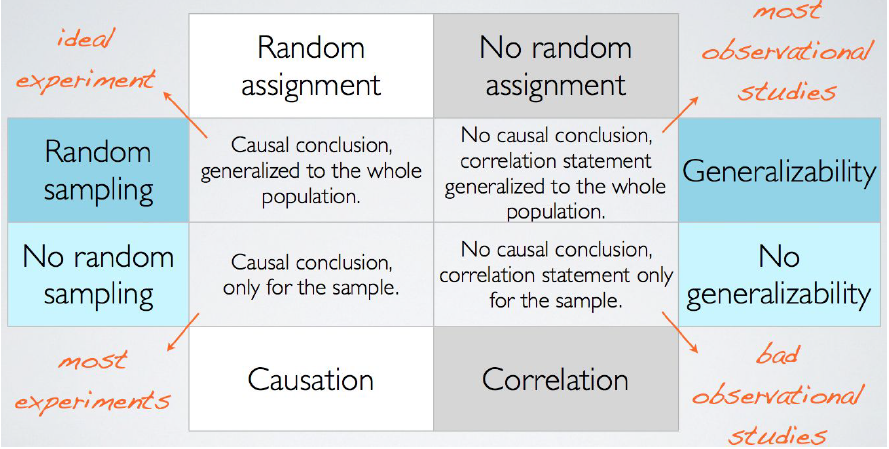
Figure 5.? Random Assignment vs. Random Sampling
Let’s walk through an example.
What if you use random assignment & random sampling, like a true experiment? You might take a random sample of student email addresses at your university and invite them to participate in your study on exercise and stress. You would randomly assign half of the participants to a prescribed workout regimen of 30 minutes of cardio per day and collect data on the stress levels in all participants in both groups via questionnaires and blood tests for biomarkers such as cortisol. Your results could validly conclude that any differences in stress between the two groups were caused by the exercise regimen because it was randomly assigned, and those conclusions can be generalized to the whole student body because it was a random sample.
What if you use random assignment only, like a pilot experiment? You might advertise your study on campus and ask volunteers to participate. Once you have recruited enough participants, you would randomly assign half of them to the exercise treatment. Your results could validly conclude that the effects of exercise on stress are causal because you used random assignment, but you could not generalize beyond your sample because you did not use random sampling. There could be characteristics about those that volunteered to participate that influence how effective the treatment is likely to be as compared to those who chose not to participate.
What if you random sampling only, like a good survey? You might take a random sample of student email addresses at your university and invite them to participate in your study. You could collect data on their exercise habits and their stress, and If your data indicates a negative relationship between exercise and stress (i.e. as exercise increases, stress decreases), you can conclude that relationship is generalizable to the whole student body, but you cannot claim that increased exercise caused reduced stress. There could be confounding characteristics about students who choose to exercise more that also reduce their stress (e.g. better sleep or nutrition habits).
What if you used neither random assignment nor random sampling, like a bad survey or good qualitative project? You might advertise your study on campus and ask volunteers to participate. You could collect data on their exercise habits and their stress. Whatever your data indicates between exercise and stress, you can only validly conclude that the relationship is associational and true for your sample only. There may differences between people in your sample who choose to exercise and those who do not, as well as differences between people who volunteered to participate in your study and those who did not. That being said, by engaging with your participants in detail, you could uncover deeper truths using qualitative methods. Perhaps the reason why students do not experience a change under the exercise protocol is that they are experiencing food insecurity, labor market exploitation, and other issues faced by college students. These patterns could only be uncovered through the non-random sampling procedures associated with qualitative methods.
Representativeness
In order to select a sample from a population, a sampling frame must be created. The sampling frame is the (real or hypothetical) list of all possible individuals or documents that researchers attempt to recruit into their study. No sampling frame is perfect! Identifying a setting where your participants are likely to be, getting the approval of a gatekeepers to those participants, and many other factors require compromises that might impact the generalizability of the sampling frame to the overall population. When the sampling frame differs from the population, sampling error occurs. For example, people without phone numbers would have a 0% chance of being sampled for a phone survey, even if they are part of the population of interest.
The purpose of quantitative methods is to arrive at a representative sample of the overall population. Generally speaking, you want to evaluate the sample to see whether participants are similar along demographic (e.g., age, race, sex) and other factors relevant to the research question. Qualitative methods can try to maximize for participant diversity, but it also may prioritize critical cases, political cases, or theory-informed approaches to sampling over maximum variation.
Generally speaking, larger samples are more generalizable than smaller ones. If the sample size is not listed in the abstract, look in the Methods section under sample, participants, or a similar heading. Look for the response rate. The higher the response rate, the better. Nonresponse introduces bias into the research process by introducing a third variable, the degree to which the sample excludes people without the time (and other resources) to fully participate, which may make its results less generalizable. Consult the limitations section of a journal article for any issues the researchers faced during recruitment.
Qualitative researchers do not maximize sample size. Once there are no new people or other data sources that will add new depth to their knowledge, they stop sampling. Unlike in quantitative research, qualitative researchers may change their sampling approach during the project. Adaptation to context is important to uncover hidden truths.
Interpreting Table 1
Although you might assume Table 1 of the Results section is the most important table for the study’s research question, it is almost always descriptive information about the study’s sample. While the Methods section describes how the sample was collected, the Results section begins by providing demographic variables (e.g., age, race, sex) and other variables relevant to the research question. While you would not use Table 1 to find information about the research question of an empirical article, it is tremendously useful for assessing the transferability of a sample to another context as well as generalizability to broader populations.
Beginning with generalizability, look at Table 1 and the first paragraph of the Results section to get a demographic breakdown of the sample. I often research social work students, and while a sample that is half cisgender male social work students might be informative, it certainly does not generalize to the population of students. Thinking critically about the factors relevant to your research question and what other studies demonstrate about the people in your target population, assess whether the study’s actual participants are generalizable.
Looking at transferability, start with the Methods section. Would the recruitment process collect participants that are similar to those in your research question, or would they have excluded participants like your like those in your question (e.g., people with co-occurring diagnoses)? Does the setting or sampling frame from which participants were selected look and feel like the context in your research question? Is the sample diverse enough? Transferability is particularly important if you plan to engage in qualitative inquiry.
Key Takeaways
- Random sampling will elicit more generalizable results than non-probability approaches
- Larger samples with higher response rates are more generalizable
- Reading Table 1 is necessary to understand the sample recruited into a study.
Exercises
Select a quantitative empirical article related to your topic.
- What is the sample size?
- Did the authors use probability or non-probability sampling approaches?
- What is the sampling frame from which the same was drawn?
- What was the response rate?
- Does the study’s sample, as represented in Table 1, seem representative of the target population?
5.3 Generalizability & transferability of a study’s results
Learning Objectives
Learners will be able to…
- Use statistical significance and confidence intervals to understand the important findings of an empirical journal article
- Differentiate between qualitative and quantitative results in an empirical journal article
In previous sections, we have focused on the introduction and discussion to get a sense of the overall literature. Now that you have identified an article whose design matches your information need, we need to understand a bit more about how the statistics reported in the sample generalize to broader populations. This section is all about how to read and interpret the results of an empirical (quantitative or qualitative) journal article. Our discussion here will be basic, and in parts two and three of the textbook, you will learn more about how to perform and interpret basic statistical tests and qualitative data analysis techniques.
Remember, this section only addresses empirical articles. Non-empirical articles (e.g., theoretical articles, literature reviews) don’t have results. They cite the analysis of raw data completed by other authors. The authors of non-empirical articles are summarizing and expanding upon other researchers’ empirical work. If you plan to cite an empirical statistic in your study, you can use this section to quickly confirm that information in the results section of the primary source.
Read beyond the abstract
Using the summarized results in an abstract is an understandable mistake to make. Without having completed more advanced coursework on statistical or qualitative analysis, some of the terminology, symbols, or diagrams in the Results may be difficult to comprehend. I want to normalize not understanding statistics terms and symbols. Do not fear. A basic understanding of a results section goes a very long way. You need to read the results section of a journal article to fully understand what the researchers found.
Measures and methods
Before you go into the results section, start by browsing the measures subsection of the journal article’s methods section. A quantitative study uses well-established measures and cites psychometric evidence its measures are valid and reliable. You can be more confident in standardized measurements, and thoroughly pretested scales authored by the researchers, than bespoke measures drafted by the researchers and used for the first time. While bespoke measures are certainly okay to use, standardized measures make it easier to eliminate measurement error as a threat to the generalizability of a causal relationship.
You should be able to match the measures listed in the methods section to statistical results. If a social work researcher were assessing the outcomes of a therapeutic intervention, the measures section would describe the standardized or bespoke measures for each outcome variable. Using a standardized measure of depression, for example, would provide a more firm basis for causality and generalizability than creating a totally new measurement of depression symptoms.
Unlike the measures section of a quantitative journal article, qualitative measures are not intended to isolate a causal relationship from its context. Qualitative measures are the questions researchers ask participants to probe their experiences about idiographic causal relationships in focus groups and interviews. The measures section should provide the specific questions they asked each participant. Qualitative research often uses an emergent process in which interview questions, sampling, and even the research question might change over time. It should be clear to you why the researcher made the decisions they did during the research process, even if you would make a different decision. The internal rigor of the study as well as the relationship of its measures to your research project’s context should inform transferability assessment.
Tables display important results
Precise statistical results that appear in a table do not need to be repeated in the text. Instead, the writer can note major trends and alert the reader to details (e.g., specific correlations) that are of particular interest. In an APA-style article, simple results are most efficiently presented in the text, while more complex results are most efficiently presented in graphs or tables. Thus, learning how to understand tables is an important information literacy skill.
Skimming tables is a good way to begin reading the results. A table usually provides a quick, condensed summary of the report’s key findings. Tables are a concise way to report large amounts of data. Some tables present descriptive information about a researcher’s sample (often the first table in a results section). These tables will likely contain frequencies (N) and percentages (%). For example, if gender happened to be an important variable for the researcher’s analysis, a descriptive table would show how many and what percent of all study participants are of a particular gender. Frequencies or “how many” will probably be listed as N, while the percent symbol (%) might be used to indicate percentages.
In a table presenting a causal relationship, two sets of variables are represented. The independent variable, or cause, and the dependent variable, the effect. We will discuss these further when we review quantitative conceptualization and measurement. Independent variable attributes are typically presented in the table’s columns, while dependent variable attributes are presented in rows. This allows the reader to scan a table’s rows to see how values on the dependent variable change as the independent variable values change (i.e., changes in the dependent variable depend on changes in the independent variable). Tables displaying results of quantitative analysis will also likely include some information about which relationships are significant or not. We will discuss the details of significance and p-values later in this section.
Let’s look at a specific example: Table 5.1. It presents the causal relationship between gender and experiencing harassing behaviors at work. In this example, gender is the independent variable (the cause) and the harassing behaviors listed are the dependent variables (the effects).[2] Therefore, we place gender in the table’s columns and harassing behaviors in the table’s rows.
Reading across the table’s top row, we see that 2.9% of women in the sample reported experiencing subtle or obvious threats to their safety at work, while 4.7% of men in the sample reported the same. We can read across each of the rows of the table in this way. Reading across the bottom row, we see that 9.4% of women in the sample reported experiencing staring or invasion of their personal space at work while just 2.3% of men in the sample reported having the same experience. We’ll discuss p values later in this section.
| Behavior experienced at work | Women | Men | p-value |
| Subtle or obvious threats to your safety | 2.9% | 4.7% | 0.623 |
| Being hit, pushed, or grabbed | 2.2% | 4.7% | 0.480 |
| Comments or behaviors that demean your gender | 6.5% | 2.3% | 0.184 |
| Comments or behaviors that demean your age | 13.8% | 9.3% | 0.407 |
| Staring or invasion of your personal space | 9.4% | 2.3% | 0.039 |
| Note: Sample size was 138 for women and 43 for men. | |||
While you can certainly scan tables for key results, they are often difficult to understand without reading the text of the article. The article and table were meant to complement each other, and the text should provide information on how the authors interpret their findings. The table is not redundant with the text of the results section. Additionally, the first table in most results sections is a summary of the study’s sample, which provides more background information on the study than information about hypotheses and findings. It is also a good idea to look back at the methods section of the article as the data analysis plan the authors outline should walk you through the steps they took to analyze their data which will inform how they report them in the results section.
You may not understand ALL of what is on a statistical table, but you will be able to pick out what is important for application to social work practice. In order to do this work, you need to start with a DEEP BREATH and an OPEN MIND before following these simple steps.
- ORIENTATION:
- Read the title of the table in order to orient yourself. Many people skip this step due to their anxiety. The title will tell you a lot that can help you to decipher the rest of the table. Some of the questions you can ask of the title are:
- What was the purpose of the table? Summarization? Comparison? Correlation? Prediction?
- Which statistical test was used? Mean & standard deviation? Percentage? Student’s t test? Odds ratio? Chi-square? ANOVA? Go to your stats cheat sheet to remember what these are about.
- How many groups are reported on? In one-group situations we will most often be looking at mean & standard deviation as well as percentages and sometimes OLS regression or logit regression. In some OLS regression and logit regression tables, we will be comparing groups.
- INTERPRETATION OF SCORES/PERCENTAGES:
- Now take a look at the numbers, slowly and methodically in order to increase understanding and reduce anxiety.
- If one group is reported on: What are the scores or percentages for that group? Once you have interpreted these for the group in question, you are done.
- If multiple groups are reported on: What are the scores or percentages for that group? If you are dealing with a multiple group comparison, you will need to interpret statistical and clinical significance, see below.
- INTERPRETATION OF STATISTICAL SIGNIFICANCE:
- While we can see that there may be numerical differences between groups, reading those numbers alone will not tell us if there is a statistical or mathematical difference between them. Statistical significance tells us whether mathematically, there is a real difference between the groups or whether the difference noted is due to chance.
Statistical significance
The statistics reported in Table 5.1 represent what the researchers found in their sample. The purpose of statistical analysis is usually to generalize from a the small number of people in a study’s sample to a larger population of people. Thus, the researchers intend to make causal arguments about harassing behaviors at workplaces beyond those covered in the sample.
Generalizing is key to understanding statistical significance. According to Cassidy and colleagues, (2019)[3] 89% of research methods textbooks in psychology define statistical significance incorrectly. This includes an early draft of this textbook which defined statistical significance as “the likelihood that the relationships we observe could be caused by something other than chance.” If you have previously had a research methods class, this might sound familiar to you. It certainly did to me!
But statistical significance is less about “random chance” than more about the null hypothesis. Basically, at the beginning of a study a researcher develops a hypothesis about what they expect to find, usually that there is a statistical relationship between two or more variables. The null hypothesis is the opposite. It is the hypothesis that there is no relationship between the variables in a research study. Researchers then can hopefully reject the null hypothesis because they find a relationship between the variables.
For example, in Table 5.1 researchers were examining whether gender impacts harassment. Of course, researchers assumed that women were more likely to experience harassment than men. The null hypothesis, then, would be that gender has no impact on harassment. Once we conduct the study, our results will hopefully lead us to reject the null hypothesis because we find that gender impacts harassment. We would then generalize from our study’s sample to the larger population of people in the workplace.
Statistical significance is calculated using a p-value which is obtained by comparing the statistical results with a hypothetical set of results if the researchers re-ran their study a large number of times. Keeping with our example, imagine we re-ran our study with different men and women from different workplaces hundreds and hundred of times and we assume that the null hypothesis is true that gender has no impact on harassment. If results like ours come up pretty often when the null hypothesis is true, our results probably don’t mean much. “The smaller the p-value, the greater the statistical incompatibility with the null hypothesis” (Wasserstein & Lazar, 2016, p. 131).[4] Generally, researchers in the social sciences have used 0.05 as the value at which a result is significant (p is less than 0.05) or not significant (p is greater than 0.05). The p-value 0.05 refers to if 5% of those hypothetical results from re-running our study show the same or more extreme relationships when the null hypothesis is true. Researchers, however, may choose a stricter standard such as 0.01 in which only 1% of those hypothetical results are more extreme or a more lenient standard like 0.1 in which 10% of those hypothetical results are more extreme than what was found in the study.
Let’s look back at Table 5.1. Which one of the relationships between gender and harassing behaviors is statistically significant? It’s the last one in the table, “staring or invasion of personal space,” whose p-value is 0.039 (under the p<0.05 standard to establish statistical significance). Again, this indicates that if we re-ran our study over and over again and gender did not impact staring/invasion of space (i.e., the null hypothesis was true), only 3.9% of the time would we find similar or more extreme differences between men and women than what we observed in our study. Thus, we conclude that for staring or invasion of space only, there is a statistically significant relationship.
For contrast, let’s look at “being pushed, hit, or grabbed” and run through the same analysis to see if it is statistically significant. If we re-ran our study over and over again and the null hypothesis was true, 48% of the time (p=.48) we would find similar or more extreme differences between men and women. That means these results are not statistically significant.
This discussion should also highlight a point we discussed previously: that it is important to read the full results section, rather than simply relying on the summary in the abstract. If the abstract stated that most tests revealed no statistically significant relationships between gender and harassment, you would have missed the detail on which behaviors were and were not associated with gender. Read the full results section! And don’t be afraid to ask for help from a professor in understanding what you are reading, as results sections are often not written to be easily understood.
Statistical significance and p-values have been critiqued recently for a number of reasons, including that they are misused and misinterpreted (Wasserstein & Lazar, 2016)[5], that researchers deliberately manipulate their analyses to have significant results (Head et al., 2015)[6], and factor into the difficulty scientists have today in reproducing many of the results of previous social science studies (Peng, 2015).[7] For this reason, we share these principles, adapted from those put forth by the American Statistical Association,[8] for understanding and using p-values in social science:
- P-values provide evidence against a null hypothesis.
- P-values do not indicate whether the results were produced by random chance alone or if the researcher’s hypothesis is true, though both are common misconceptions.
- Statistical significance can be detected in minuscule differences that have very little effect on the real world.
- Nuance is needed to interpret scientific findings, as a conclusion does not become true or false when the p-value passes from p=0.051 to p=0.049.
- Real-world decision-making must use more than reported p-values. It’s easy to run analyses of large datasets and only report the significant findings.
- Greater confidence can be placed in studies that pre-register their hypotheses and share their data and methods openly with the public.
- “By itself, a p-value does not provide a good measure of evidence regarding a model or hypothesis. For example, a p-value near 0.05 taken by itself offers only weak evidence against the null hypothesis. Likewise, a relatively large p-value does not imply evidence in favor of the null hypothesis; many other hypotheses may be equally or more consistent with the observed data” (Wasserstein & Lazar, 2016, p. 132).
Table 10.3 reflect classical thinking about statistical significance but are not a hard and fast rule.
|
Table 10.3: Range of statistical significance levels |
||
|
Not statistically significant |
Approaching significance |
Statistically significant |
|
p<.99-p<.80-p<.70-p<.60-p<.50- p<.40-p<.30- p<.20-p<.10 |
p<.09-p<.08- p<.07-p<.06 |
p<.05*-p<.04*- p<.03*-p<.02*- p<.01**-p<.001*** |
Effect size
(adapted from https://pressbooks.bccampus.ca/rmip3amed/chapter/12-2-describing-statistical-relationships/)
It is also important to be able to describe the strength of a statistical relationship, which is often referred to as the effect size. The most widely used measure of effect size for differences between group or condition means is called Cohen’s d, which is the difference between the two means divided by the standard deviation.
A Cohen’s d of 0.50 means that the two group means differ by 0.50 standard deviations (half a standard deviation). A Cohen’s d of 1.20 means that they differ by 1.20 standard deviations. But how should we interpret these values in terms of the strength of the relationship or the size of the difference between the means? Table 12.4 presents some guidelines for interpreting Cohen’s d values in psychological research (Cohen, 1992)[2]. Values near 0.20 are considered small, values near 0.50 are considered medium, and values near 0.80 are considered large. Thus a Cohen’s d value of 0.50 represents a medium-sized difference between two means, and a Cohen’s d value of 1.20 represents a very large difference in the context of psychological research. In the research by Ollendick and his colleagues, there was a large difference (d = 0.82) between the exposure and education conditions.
| Relationship strength | Cohen’s d | Pearson’s r |
| Strong/large | 0.80 | ± 0.50 |
| Medium | 0.50 | ± 0.30 |
| Weak/small | 0.20 | ± 0.10 |
Cohen’s d is useful because it has the same meaning regardless of the variable being compared or the scale it was measured on. A Cohen’s d of 0.20 means that the two group means differ by 0.20 standard deviations whether we are talking about scores on the Rosenberg Self-Esteem scale, reaction time measured in milliseconds, number of siblings, or diastolic blood pressure measured in millimeters of mercury. Not only does this make it easier for researchers to communicate with each other about their results, it also makes it possible to combine and compare results across different studies using different measures.
Be aware that the term effect size can be misleading because it suggests a causal relationship—that the difference between the two means is an “effect” of being in one group or condition as opposed to another. Imagine, for example, a study showing that a group of exercisers is happier on average than a group of nonexercisers, with an “effect size” of d = 0.35. If the study was an experiment—with participants randomly assigned to exercise and no-exercise conditions—then one could conclude that exercising caused a small to medium-sized increase in happiness. If the study was cross-sectional, however, then one could conclude only that the exercisers were happier than the nonexercisers by a small to medium-sized amount. In other words, simply calling the difference an “effect size” does not make the relationship a causal one.
Sex Differences Expressed as Cohen’s d
Researcher Janet Shibley Hyde has looked at the results of numerous studies on psychological sex differences and expressed the results in terms of Cohen’s d (Hyde, 2007)[3]. Following are a few of the values she has found, averaging across several studies in each case. (Note that because she always treats the mean for men as M1 and the mean for women as M2, positive values indicate that men score higher and negative values indicate that women score higher.)
| Mathematical problem solving | +0.08 |
| Reading comprehension | −0.09 |
| Smiling | −0.40 |
| Aggression | +0.50 |
| Attitudes toward casual sex | +0.81 |
| Leadership effectiveness | −0.02 |
Hyde points out that although men and women differ by a large amount on some variables (e.g., attitudes toward casual sex), they differ by only a small amount on the vast majority. In many cases, Cohen’s d is less than 0.10, which she terms a “trivial” difference. (The difference in talkativeness discussed in Chapter 1 was also trivial: d = 0.06.) Although researchers and non-researchers alike often emphasize sex differences, Hyde has argued that it makes at least as much sense to think of men and women as fundamentally similar. She refers to this as the “gender similarities hypothesis.”
Confidence intervals
Because of the limitations of p-values, scientists can use other methods to determine whether their models of the world are true. One common approach is to use a confidence interval, or a range of values in which the true value is likely to be found. Confidence intervals are helpful because, as principal #5 above points out, p-values do not measure the size of an effect (Greenland et al., 2016).[9] Remember, something that has very little impact on the world can be statistically significant, and the values in a confidence interval would be helpful. In our example from Table 5.1, imagine our analysis produced a confidence interval that women are 1.2-3.4x more likely to experience “staring or invasion of personal space” than men. As with p-values, calculation for a confidence interval compares what was found in one study with a hypothetical set of results if we repeated the study over and over again. If we calculated 95% confidence intervals for all of the hypothetical set of hundreds and hundreds of studies, that would be our confidence interval.
Confidence intervals are pretty intuitive. As of this writing, my wife and are expecting our second child. The doctor told us our due date was December 11th. But the doctor also told us that December 11th was only their best estimate. They were actually 95% sure our baby might be born any time in the 30-day period between November 27th and December 25th. Confidence intervals are often listed with a percentage, like 90% or 95%, and a range of values, such as between November 27th and December 25th. You can read that as: “we are 95% sure your baby will be born between November 27th and December 25th because we’ve studied hundreds of thousands of fetuses and mothers, and we’re 95% sure your baby will be within these two dates.”
Notice that we’re hedging our bets here by using words like “best estimate.” When testing hypotheses, social scientists generally phrase their findings in a tentative way, talking about what results “indicate” or “support,” rather than making bold statements about what their results “prove.” Social scientists have humility because they understand the limitations of their knowledge. In a literature review, using a single study or fact to “prove” an argument is red flag to the person reading your literature review (usually your professor) that you may not have appreciated the limitations of that study or its place in the broader literature on the topic. Strong arguments in a literature review include multiple facts and ideas that span across multiple studies.
Univariate statistics: Mean and standard deviation
(adapted from https://pressbooks.bccampus.ca/rmip3amed/chapter/12-3-expressing-your-results/#:~:text=Another%20common%20use,easier%20to%20read)
The most common use of tables is to present several means and standard deviations—usually for complex research designs with multiple independent and dependent variables. Figure 12.14, for example, shows the results of a hypothetical study similar to the one by MacDonald and Martineau (2002)[1] . Researchers categorized participants as having low or high self-esteem, put them into a negative or positive mood, and measured their intentions to have unprotected sex. They also measured participants’ attitudes toward unprotected sex.
Let’s look at the APA formatting. Notice that the table includes horizontal lines spanning the entire table at the top and bottom, and just beneath the column headings. Furthermore, every column has a heading—including the leftmost column—and there are additional headings that span two or more columns that help to organize the information and present it more efficiently. Finally, notice that APA-style tables are numbered consecutively starting at 1 (Table 1, Table 2, and so on) and given a brief but clear and descriptive title.
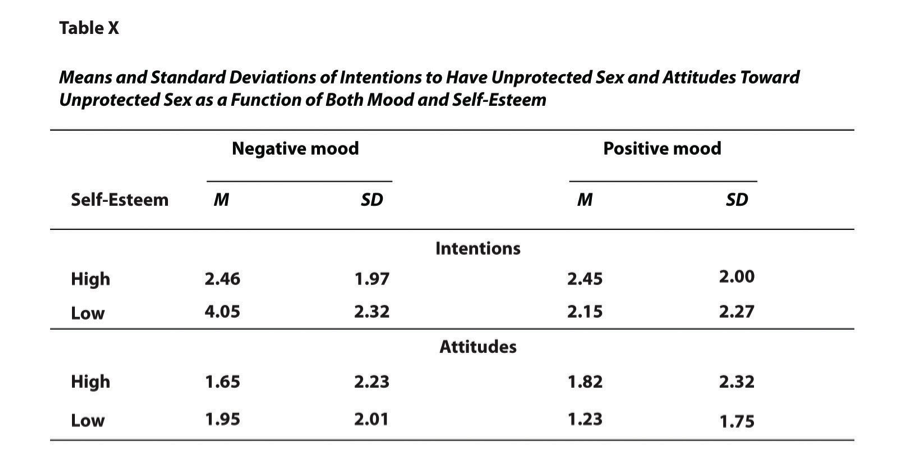
Univariate statistics describe the distribution of a single variable. They usually appear at the beginning of a results section. While they can tell you basic information about the population, and that might be useful for your literature review, univariate statistics are useful as inputs into more advanced statistics.
Bivariate statistics: Correlation
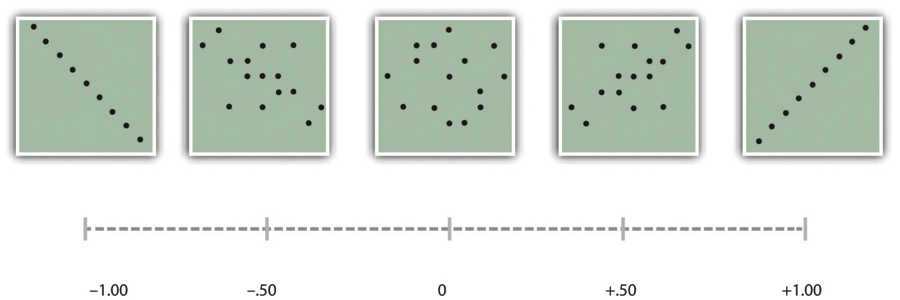
The strength of a correlation between quantitative variables is typically measured using a statistic called Pearson’s r. As Figure 12.9 shows, its possible values range from −1.00, through zero, to +1.00. A value of 0 means there is no relationship between the two variables. Values near ±.10 are considered small, values near ± .30 are considered medium, and values near ±.50 are considered large. Notice that the sign of Pearson’s r is unrelated to its strength. Pearson’s r values of +.30 and −.30, for example, are equally strong; it is just that one represents a moderate positive relationship and the other a moderate negative relationship. Like Cohen’s d, Pearson’s r is also referred to as a measure of “effect size” even though the relationship may not be a causal one.
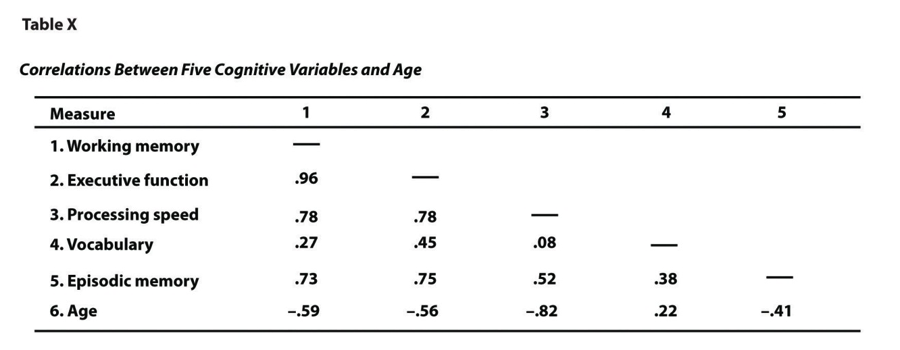
Another common use of tables is to present correlations—usually measured by Pearson’s r—among several variables. This kind of table is called a correlation matrix. Figure 12.15 is a correlation matrix based on a study by David McCabe and colleagues (McCabe, Roediger, McDaniel, Balota, & Hambrick, 2010)[2]. They were interested in the relationships between working memory and several other variables. We can see from the table that the correlation between working memory and executive function, for example, was an extremely strong .96, that the correlation between working memory and vocabulary was a medium .27, and that all the measures except vocabulary tend to decline with age. Notice here that only half the table is filled in because the other half would have identical values. For example, the Pearson’s r value in the upper right corner (working memory and age) would be the same as the one in the lower left corner (age and working memory). The correlation of a variable with itself is always 1.00, so these values are replaced by dashes to make the table easier to read.
There are many other bivariate tests, but correlations are a good place to start. Assess the p-values of any bivariate test to find the significant relationships and use the guidelines in this chapter to assess the strength of correlations.
Prioritize multivariate results
Chi-square, t-tests, ANOVA, and Pearson’s r. are fine tests, and you will learn how to perform bivariate analysis by the end of this book, but it is exceedingly rare for studies to be published using solely bivariate statistics. If you are citing the results of a bivariate analysis in your study, please double check and make sure there are no multivariate methods provided after the bivariate analyses. Researchers most often use bivariate tests to demonstrate a general trend that multivariate statistics like regression, MANOVA, and structural equation modeling can more comprehensively pursue because they can include more than one independent variable (or dependent variable).
How do you know where the final results are? The text of the results section should provide some clues (e.g., “in our final model…”). Some researchers organize their results by research question, with one subsection per question. Other researchers have only one research question, with the results section building up to the final statistical test. Look towards the end of the results section or the end of each subsection for the researcher’s final answer to a research question.
Multiple regression
(adapted from https://usq.pressbooks.pub/statisticsforresearchstudents/chapter/multiple-regression-assumptions/) and (https://pressbooks.pub/eslayter/chapter/chapter-12-critical-consumption-of-multivariate-evaluation-data/)
In regression analysis, a “model” is a set of independent measures that are thought to relate to the outcome measure of interest. The goal is to test the model to see how much of the variation in the outcome, family reunification in this case, is explained. Most social science researchers use multiple regression, which includes two or more independent variables – sometimes called predictor variables – in the model, rather than just one independent variable.
As such, the purpose of multiple regression is to determine the utility of a set of predictor variables for predicting an outcome, which is generally some important event or behavior. This outcome can be designated as the outcome variable, the dependent variable, or the criterion variable. For example, you might hypothesize that the need to belong will predict motivations for Instagram use and that self-esteem and meaningful existence will uniquely predict motivations for Instagram use. We will skip the assumptions necessary for a linear regression, but please look in the results section or limitations section to see if the researchers report violating them.
Standard regression: Look for R-squared
There are two main types of regression with multiple independent variables. In the Standard or Single Step approach, all predictors enter the regression together. If the results section indicates only a standard multiple regression, there will be only one regression to interpret. Each predictor is treated as if it had been analyzed in the regression model after all other predictors had been analyzed. These predictors are evaluated by the shared variance (i.e., level of prediction) shared between the dependent variable and the individual predictor variable.
Figure 5.? contains a standard regression analysis output.
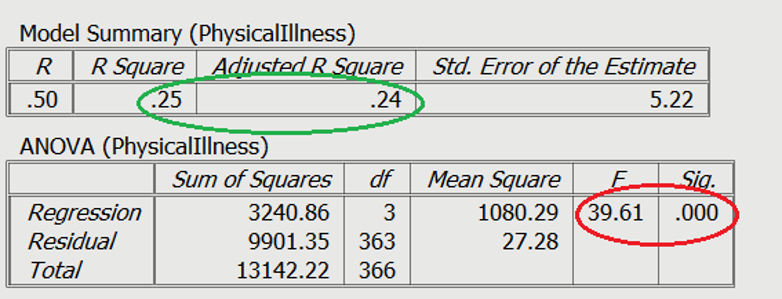
You can see in the red circle that the test statistics are significant. The F-statistic examines the overall significance of the model, and shows if your predictors as a group provide a better fit to the data than no predictor variables, which they do in this example. The R2 values are shown in the green circle. The R2 value shows the total amount of variance accounted for in the dependent variable by the predictor variables, and the adjusted R2 is the estimated value of R2 in the population. If the R-squared value is very low, the results may of little practical importance even if they are statistically significant.
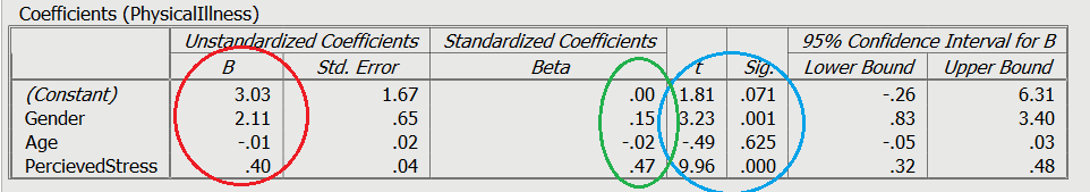
You can also use tables to examine the impact of individual predictor (independent) variables. In Figure 5.?, you can see the significance of the contribution of individual predictors in light blue. The unstandardized slope or the B value is shown in red, which represents the change caused by the variable (e.g., increasing 1 unit of perceived stress will raise physical illness by .40). Finally, you can see the standardized slope value in green, which are also known as beta values. These values are standardized ranging from +/-0 to 1, similar to an r value. The closer to 1, the stronger the positive relationship. The closer to -1, the stronger the negative relationship. The closer to 0, the weaker the relationship.
Hierarchical regression: Prioritize the final model
Unlike standard regression, hierarchical regression is a step-wise approach in which predictor variables are entered in blocks. Each block represents one step (or model). The order (or which predictor goes into which block) to enter predictors into the model is decided by the researcher, but should always be based on theory.
The first block entered into a hierarchical regression can include “control variables,” which are variables that we want to hold constant. In a sense, researchers want to account for the variability of the control variables by removing it before analyzing the relationship between the predictors and the outcome.
The example research question is “what is the effect of perceived stress on physical illness, after controlling for age and gender?”. To answer this research question, we will need two blocks. One with age and gender, then the next block including perceived stress.
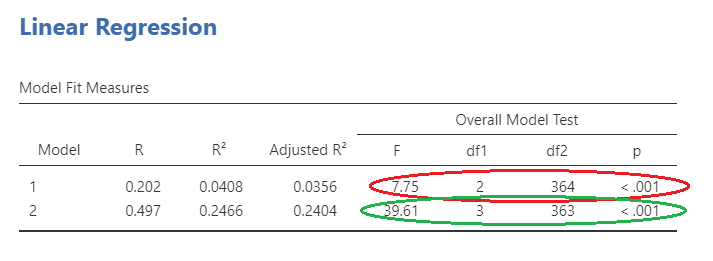
Figure 5.? shows the overall model statistics. The first model, with only age and gender, can be seen circled in red. This model is obviously significant. The second model (circled in green) includes age, gender, and perceived stress. As you can see, the F statistic is larger for the second model. However, does this mean it is significantly larger?
To answer this question, we will need to look at the model change statistics on Figure 5.?. The R value for model 1 can be seen here circled in red as .202. This model explains approximately 4% of the variance in physical illness. The R value for model 2 is circled in green as .497, and explains a more sizeable part of the variance, about 25%.
This statistical test should be read as a percentage. Remember that in fourth grade math, 1.0 is equal to 100%, .99 is equal to 99% and so on. When we interpret the percentage, we can see that 54% of the outcome was explained by the combination of independent measures we chose to include in our regression analysis.
This tells us that while our two measures or “model” predicts over half of the outcome, there are some measures that are missing. In other words, there are other factors that predict the family reunification outcome that are not included in this model. Something to consider for our next evaluation. This interpretation helps us to see the spectrum of factors that we should work on with clients that are geared towards a positive outcome.
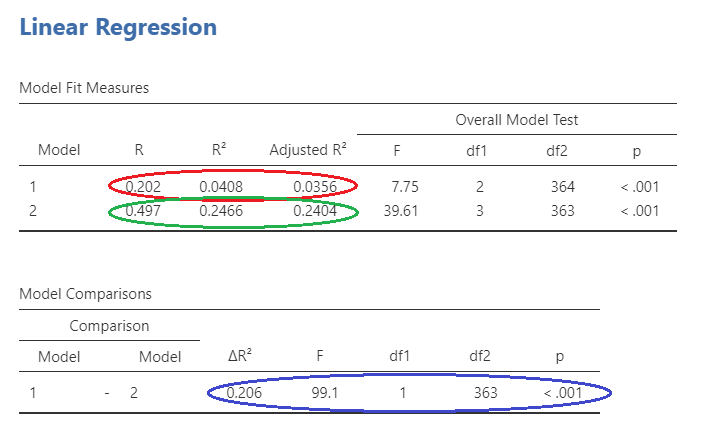
The significance of the change in the model can be seen in blue on Slide 3. The information you are looking at is the R squared change, the F statistic change, and the statistical significance of this change.
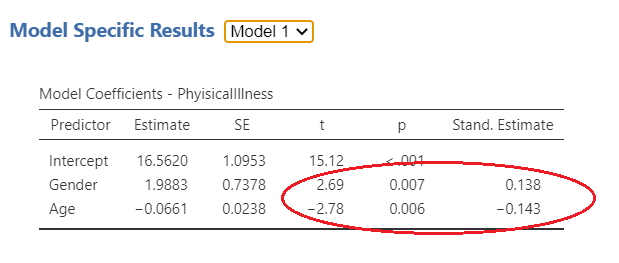
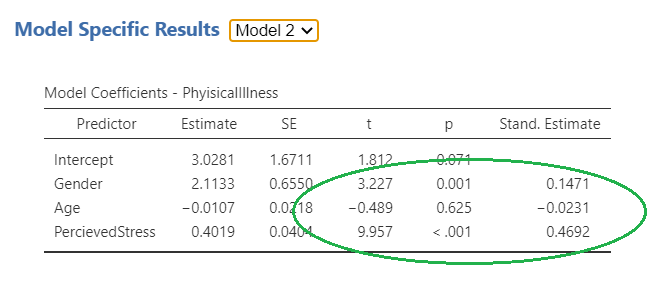
In the final model pictures in Figure 5.?, you can examine the role of each individual independent variable on the dependent variable. For model one, as circled in red, age and gender are both significantly associated with physical illness. In this case, age is negatively associated (i.e. the younger you are, the more likely you are to be healthy), and gender is positively associated (in this case being female is more likely to result in more physical illness). For model 2, gender is still positively associated and now perceived stress is also positively associated. However, age is no longer significantly associated with physical illness following the introduction of perceived stress. Thus, it is important to analyze the final model in a hierarchical regression to get the full picture of a researcher’s intentions.
OLS and Logit regression: Look for odds ratios
Let’s start to understand the utility of logit regression analysis by interpreting the impact of various factors on family reunification visualized Table 10.7. After grounding ourselves with the title, so we know what we are focusing on, we move on to the second row. We can see that there is a column where the independent measures – or factors we are interested in – are listed.
The next column has what appears to be gibberish, Exp(B). This is statistical language, but what it is important to know is that this column gives us what is called an odds ratio to interpret that links the independent measure to the outcome measure. To interpret the odds ratio along this line of the table, we look at the number in the child abuse potential score row and the Exp(B) column. We see the number 2.2. This tells us parents with low child abuse potential scores were 2.2 times more likely to be reunified with their children, “controlling for” (taking into consideration) the other independent measure in the model, which is about achieving reunification goals. Our p value tells us that this is a statistically significant finding, meaning it is not due to chance.
Let’s say that our odds ratio had been 0.23 instead of 2.3. In this situation, we subtract 0.23 from 1, and get .77. We interpret this as a percent. This would tell us that parents with low child abuse potential scores were 77% less likely to reunify with their children (which doesn’t make a whole lot of common sense, but this is just an example). When our odds ratios are positive, we talk about “times more likely” and when they are negative, we talk about “percent less likely.”
If we move to a focus on the other independent measure, we are focusing on parents who achieved their reunification goals versus those who did not with respect to whether their family was reunified. Our odds ratio tells us that parents who achieved their reunification goals were 10.1 times more likely to reunify with their children, controlling for the child abuse potential score measure. This is also a statistically significant difference.
|
Table 10.7: Logit regression predicting family reunification |
|||
|
Independent measures |
Exp(B)
|
Confidence intervals |
P value |
|
Has low child abuse potential score at end of intervention (yes/no) |
2.30 |
1.75-2.46 |
p<.001 |
|
Achieved all reunification goals within one year (yes/no) |
10.1 |
9.2-11.6 |
p<.05 |
|
*p< .05; **p< .01; ***p< .001 Nagelkerke R2=0.54 |
|||
Let’s talk about the way that odds ratio scores help us to determine clinical meaningfulness. We only start paying attention to odds ratios as meaningful at a certain cutoff point. In research as a second language we talk about this as an “effect size.” As Chen, Cohen, and Chen (2010) note, “the odds ratio (OR) is probably the most widely used index of effect size in epidemiological studies” (p. 860). Further, these authors suggest that odds ratios of 1.68, 3.47, and 6.71 are equivalent to Cohen’s d effect sizes of 0.2 (small), 0.5 (medium), and 0.8 (large), respectively” (p. 860). So unless your odds ratio is above 1.68, you shouldn’t really consider it to be clinically meaningful. That’s a good rule of thumb.
There should be some familiar items in the table above. The third column gives us confidence intervals which are akin to a margin of error, telling us how low and how high the odds ratio could be. Finally, the p value tells us whether there is a statistically significant relationship between the independent measure and the outcome measure.
The last thing we need to pay attention to is the last row, where we see the term “Nagelkerke R2.” This is the name of a statistical test that tells us how much the set of independent measures (together) explains the variation in the outcome. You can think of this as a quality measure. The r-squared tells us that while our two measures or “model” predicts over half of the outcome, there are some measures that are missing. In other words, there are other factors that predict the family reunification outcome that are not included in this model. This interpretation helps us to see the spectrum of factors that we should work on with clients that are geared towards a positive outcome.
Making conclusions about the full model or specific variables in the model
Let’s look at how to break apart regression models, or keep them together, to make conclusions about the relationship between variables. In this example, we are trying to predict what increases the outcome measure of child abuse potential, measured on a 1-100 scale. After grounding ourselves with the title, so we know what we are focusing on, we move on to the second row. We can see the terms “beta” and p value. We know that the p value tells us about statistical significance, but what about this beta thing? The beta score tells us about the relationship between the independent measure to the outcome measure. We’ll interpret that in just a bit.
|
Table 10.8: OLS regression analysis predicting child abuse potential score |
||
|
Independent measures |
Beta |
P value |
|
Parental age |
0.24 |
NS |
|
Days of child welfare involvement |
1.08 |
p<.05 |
|
*p< .05; **p< .01; ***p< .001 NS=no significance R2=0.72 |
||
Moving to the first column, we see that the “model” (or set of independent measures) includes parental age and the number of days a family has been involved in the child welfare system. The latter measure could be considered a proxy or stand-in measure for the complexity of the child welfare case. There are two ways to interpret a regression.
Interpretation 1: In this interpretation we are using OLS regression to predict child abuse potential scores (our outcome measure) among child welfare-involved parents, and we have a two-measure “model.” We set out to predict change in child abuse potential score. In this interpretation we focus on the R2 percentage (note that it is not the Nagelkerke R2but the regular plain old R2). In this evaluation, our model predicted 72% of the variation in the outcome, the child abuse potential score.
Interpretation 2: In this interpretation we are still using OLS regression to predict child abuse potential score (our outcome measure) among child welfare-involved parents, and we are looking at the same two-measure “model.” In this approach to interpretation, we look at one independent measure’s relationship to the outcome measure at a time. One of our measures tells us how parental age is (or is not) related to child abuse potential score, so let’s start there.
Right off the bat, we may notice that the finding is not significant – this means that a parent’s age is not related to child abuse potential scores when controlling for days of child welfare involvement. If this was statistically significant, for every year of a parent’s life, the child abuse potential score went up by 0.24 points, controlling for the other measure in the model. This would have told us that as parents are older, their child abuse potential goes up a little bit.
Now, we need to see what the relationship between days of child welfare involvement and child abuse potential score is. Looking at the beta score we see that for evert additional day a family is child welfare-involved, their child abuse potential score goes up. This suggests that something about child welfare involvement is not conducive to being a good parent, which is counterintuitive. This is something to be considered carefully by the evaluation team in order to try to change practice in this area.
Beyond regression
There are an extraordinary number of quantitative approaches to statistics. This short introduction focused on the key statistic for the most popular approach in social science, linear regression. Nearly two-thirds of social science literature uses linear regression as a quantitative research methods. Scanning for significant relationships, R-squared values, odds ratios, and confidence intervals, you can make more detailed arguments in your literature review. (https://direct.mit.edu/qss/article/5/2/426/119743/The-use-of-linear-models-in-quantitative-research)
Qualitative results
Quantitative articles will contain a lot of numbers and the results of statistical tests demonstrating associations between those numbers. Qualitative articles, on the other hand, will consist mostly of quotations from participants. For most qualitative articles, the authors want to put their results in the words of their participants, as they are the experts. Articles that lack quotations make it difficult to assess whether the researcher interpreted the data in a trustworthy, unbiased manner. These types of articles may also indicate how often particular themes or ideas came up in the data, potentially reflective of how important they were to participants.
Authors often organize qualitative results by themes and subthemes. For example, see this snippet from the results section in Bonanno and Veselak (2019)[10] discussion parents’ attitudes towards child mental health information sources.
Data analysis revealed four themes related to participants’ abilities to access mental health help and information for their children, and parents’ levels of trust in these sources. These themes are: others’ firsthand experiences family and friends with professional experience, protecting privacy, and uncertainty about schools as information sources. Trust emerged as an overarching and unifying concept for all of these themes.
Others’ firsthand experiences. Several participants reported seeking information from other parents who had experienced mental health struggles similar to their own children. They often referenced friends or family members who had been or would be good sources of information due to their own personal experiences. The following quote from Adrienne demonstrates the importance of firsthand experience:
[I would only feel comfortable sharing concerns or asking for advice] if I knew that they had been in the same situation. (Adrienne)
Similarly, Michelle said: And I talked to a friend of mine who has kids who have IEPs in the district to see, kind of, how did she go about it. (Michelle)
…
Friends/family with professional experience. Several respondents referred to friends or family members who had professional experience with or knowledge of child mental health and suggested that these individuals would be good sources of information. For example, Hannah said:
Well, what happened with me was I have an uncle who’s a psychiatrist. Sometimes if he’s up in (a city to the north), he’s retired, I can call him sometimes and get information. (Hannah)
Michelle, who was in nursing school, echoed this sentiment: At this point, [if my child’s behavioral difficulties continued], I would probably call one of my [nursing] professors. That’s what I’ve done in the past when I’ve needed help with certain things…I have a professor who I would probably consider a friend who I would probably talk to first. She has a big adolescent practice. (Michelle) (p. 402-403)
The terms in bold above refer to the key themes (i.e., qualitative results) that were present in the data. Researchers will state the process by which they interpret each theme, providing a definition and usually some quotations from research participants. Researchers will also draw connections between themes, note consensus or conflict over themes, and situate the themes within the study context.
Qualitative results are specific to the time, place, and culture in which they arise, so you will have to use your best judgment to determine whether these results are relevant to your study. For example, students in my class at Radford University in Southwest Virginia may be studying rural populations. Would a study on group homes in a large urban city transfer well to group homes in a rural area?
Maybe. But even if you were using data from a qualitative study in another rural area, are all rural areas the same? How is the client population and sociocultural context in the article similar or different to the one in your study? Qualitative studies have tremendous depth, but researchers must be intentional about drawing conclusions about one context based on a study in another context. To make conclusions about how a study applies in another context, researchers need to examine each component of an empirical journal article–they need to annotate!
Key Takeaways
- The results section of empirical articles are often the most difficult to understand.
- To understand a quantitative results section, look for results that were statistically significant and examine the confidence interval, if provided.
- To understand a qualitative results section, look for definitions of themes or codes and use the quotations provided to understand the participants’ perspective.
Exercises
Select a quantitative empirical article related to your topic.
- Write down the results the authors identify as statistically significant in the results section.
- How do the authors interpret their results in the discussion section?
- Do the authors provide enough information in the introduction for you to understand their results?
Select a qualitative empirical article relevant to your topic.
- Write down the key themes the authors identify and how they were defined by the participants.
- How do the authors interpret their results in the discussion section?
- Do the authors provide enough information in the introduction for you to understand their results?
5.4 Annotating empirical journal articles
Learning Objectives
Learners will be able to…
- Define annotation and describe how to use it to identify, extract, and reflect on the information you need from an article
Now that you know how to skim the result section of a journal article to pull out the relevant statistics like p-values, confidence intervals, effect sizes, and odds ratios, it’s time to put those skills to use in closely reading a research journal article. This final section provides steps for annotating an empirical journal article as well as summary information for previous sections on sampling, measures, results, and design.
Annotation: Make space for reflection
Annotation refers to the process of writing notes on an article. There are many ways to do this. The most basic technique is to print out the article and build a binder related to your topic. Raul Pacheco-Vega’s excellent blog has a post on his approach to taking physical notes. Honestly, while you are there, browse around that website. It is full of amazing tips for students conducting a literature review and graduate research projects.
I see a lot of benefits to the paper, pen, and highlighter approach to annotating articles. Personally though, I prefer to use a computer to write notes on an article because my handwriting is terrible and typing notes allows me search for keywords. As I mentioned Zotero is amazing because it syncs my annotations across all of my devices. I can highlight a section of an article, insert a hashtag, and link it with other articles. I don’t mind reading on a screen, and I often prefer it since I read on-the-go like when I’m in the car or at a playground with my kids. Zotero is not the only option. Most PDF readers like Adobe Acrobat have a commenting and highlighting feature. Using a citation manager, you can build a library of articles, save your annotations, and link annotations across PDFs using keywords. They also provide integration with word processing programs to help with citations in a reference list.
Annotation and reviewing literature does not have to be a solo project. If are working in a group, you can use the Hypothes.is web browser extension to annotate articles collaboratively. You can also use Google Drive and Adobe Acrobat to collaboratively annotate a shared PDF using the commenting feature and write collaborative notes in a shared document. Zotero also allows you to share annotations and PDFs across a group. By sharing your highlights and comments, you can split the work of getting the most out of each article you read and build off one another’s ideas.

In this section, we present common annotations people make when reading journal articles. These annotations are adapted from Craig Whippo and Raul Pacheco-Vega. If you are annotating on paper, I suggest using different color highlighters for each type of annotation listed below. If you are annotating electronically, you can use the names below as tags to easily find information later. For example, if you are searching for definitions of key concepts, you can either click on the tag for [definitions] in your PDF reader or thumb through a printed copy of article for whatever color or tag you used to indicate definitions of key terms. Most of all, you want to avoid reading through all of your sources again just to find that one thing you know you read somewhere. Time is a graduate student’s most valuable resource, so our goal here is to help you spend your time reading the literature wisely.
Critically reading a journal article
Critical reflections are all about you. Write down any questions or thoughts that come to mind as you read. If you think the author says something inaccurate or unsubstantiated, write that down. If you don’t understand something, make a note about it and ask your professor if the answer isn’t easy to find. Don’t feel bad! Journal articles are hard to understand sometimes, even for professors. Your goal is to critically read the literature, so write down what you think while reading! Table 4.2 contains some questions that might stimulate your thoughts.
| Report section | Questions to guide critical inquiry |
| Abstract | What are the key findings? How were those findings reached? How does the author frame their study? |
| Acknowledgments | Who are this study’s major stakeholders? Who provided feedback? Who provided support in the form of funding or other resources? |
| Problem statement (introduction) | How does the author frame the research focus? What other possible ways of framing the problem exist? Why might the author have chosen this particular way of framing the problem? |
| Literature review (introduction) |
What are the major themes the author identifies in the literature? Are there any gaps in the literature? Does the author address challenges or limitations to the studies they cite? Is there enough literature to frame the rest of the article or do you have unanswered questions? Does the author provide conceptual definitions for important ideas or use a theoretical perspective to inform their analysis? |
| Sample (methods) | Where was the data collected? Did the researchers provide enough information about the sample and sampling process for you to assess its quality? Did the researchers collect their own data or use someone else’s data? What population is the study trying to make claims about, and does the sample represent that population well? What are the sample’s major strengths and major weaknesses? |
| Data collection (methods) | How were the data collected? What do you know about the relative strengths and weaknesses of the methods employed? What other methods of data collection might have been employed, and why was this particular method employed? What do you know about the data collection strategy and instruments (e.g., questions asked, locations observed)? What don’t you know about the data collection strategy and instruments? Look for appendixes and supplementary documents that provide details on measures. |
| Data analysis (methods) | How were the data analyzed? Is there enough information provided for you to feel confident that the proper analytic procedures were employed accurately? How open are the data? Can you access the data in an open repository? Did the researchers register their hypotheses and methods prior to data collection? Is there a data disclosure statement available? |
| Results | What are the study’s major findings? Are findings linked back to previously described research questions, objectives, hypotheses, and literature? Are sufficient amounts of data (e.g., quotes and observations in qualitative work, statistics in quantitative work) provided to support conclusions? Are tables readable? |
| Discussion/conclusion | Does the author generalize to some population beyond the sample? How are these claims presented? Are claims supported by data provided in the results section (e.g., supporting quotes, statistical significance)? Have limitations of the study been fully disclosed and adequately addressed? Are implications sufficiently explored? |
Abstract, Introduction, and Discussion Sections
Empirical journal articles are most useful for their results section, but lengthier journal articles also have deep literature reviews that can inform your inquiry. The annotations below are intended to help you write your literature review and conceptualize an empirical study of your own, as part of a research proposal.
Background knowledge
It’s a good idea to note any relevant information the author relies on for background. When an author cites facts or opinions from others, you are subsequently able to get information from multiple articles simultaneously. For example, if we were looking at this meta-analysis about domestic violence, in the introduction section, the authors provide facts from many other sources. These facts will likely be relevant to your inquiry on domestic violence, as well.
As you are looking at background information, you should also note any subtopics or concepts about which there is controversy or consensus. The author may present one viewpoint and then an opposing viewpoint, something you may do in your literature review as well. Similarly, they may present facts that scholars in the field have come to consensus on and describe the ways in which different sources support these conclusions.
Sources of interest
Note any relevant sources the author cites. If there is any background information you plan to use, note the original source of that information. When you write your literature review, cite the original source of a piece of information you are using, which may not be where you initially read it. Remember that you should read and refer to the primary source. If you are reading Article A and the author cites a fact from Article B, you should note Article B in your annotations and use Article B when you cite the fact in your paper. You should also make sure Article A interpreted Article B correctly and scan Article B for any other useful facts.
Definitions
Note definitions of key terms for your topic. At minimum, you should include a scholarly definition for the concepts represented in your working question. If your working question asks about the process of leaving a relationship with domestic violence, your research proposal will have to explain how you define domestic violence, as well as how you define “leaving” an abusive relationship. While you may already know what you mean by domestic violence, the person reading your research proposal does not.
Annotating definitions also helps you engage with the scholarly debate around your topic. Definitions are often contested among scholars. Some definitions of domestic violence will be more comprehensive, including things such economic abuse or forcing the victim to problematically use substances. Other definitions will be less comprehensive, covering only physical, verbal, and sexual abuse. Often, how someone defines something conceptually is highly related to how they measure it in their study. Since you will have to do both of these things, find a definition that feels right to you or create your own, noting the ways in which it is similar or different from those in the literature.
Definitions are also an important way of dealing with jargon. Becoming familiar with a new content area involves learning the jargon experts use. For example, in the last paragraph I used the term economic abuse, but that’s probably not a term you’ve heard before. If you were conducting a literature review on domestic violence, you would want to search for keywords like economic abuse if they are relevant to your working question. You will also want to know what they mean so you can use them appropriately in designing your study and writing your literature review.
Theoretical perspective
Noting the theoretical perspective of the article can help you interpret the data in the same manner as the author. For example, articles on supervised injection facilities for people who use intravenous drugs most likely come from a harm reduction perspective, and understanding the theory behind harm reduction is important to make sense of empirical results. Articles should be grounded in a theoretical perspective that helps the author conceptualize and understand the data. As we discussed in Chapter 3, some journal articles are entirely theoretical and help you understand the theories or conceptual models related to your topic.
We will help you determine a theoretical perspective for your project in Chapter 8. For now, it’s a good idea to note what theories authors mention when talking about your topic area. Some articles are better about this than others, and many authors make it a bit challenging to find theory (if mentioned at all). In other articles, it may help to note which social work theories are missing from the researcher’s perspective. For example, a study’s findings might address issues of oppression and discrimination, but the authors may not use critical theory to make sense of what happened.
Methods & results sections
Using what you learned in sections 5.1, 5.2, and 5.3, the framework below focuses on three factors for annotation: generalizability, transferability, and positionality.
Research question/Purpose
Authors should be clear about the purpose of their article. Charitable authors will give you a sentence that starts with something like this:
- “The purpose of this research project was…”
- “Our research question was…”
- “The research project was designed to test the following hypothesis…”
Unfortunately, not all authors are so clear, and you may to hunt around for the research question or hypothesis. Generally, in an empirical article, the research question or hypothesis is at the end of the introduction. In non-empirical articles, the author will likely discuss the purpose of the article in the abstract or introduction.
Design
Most authors provide the design in the abstract of the journal article (e.g., experiment, survey, interview). The procedure for how researchers carried out the design is in the Methods section.
- Generalizability: Is it a meta-research project, experiment, survey, interview, or focus group design? Where does this study fall on the hierarchy of evidence?
- Transferability: If my target population were included in this study, would similar results emerge?
- Positionality: If I wanted to answer a similar question in my research project, where might I propose to collect data?
Sample
Who exactly were the study participants and how were they recruited? In quantitative studies, you will want to pay attention to the sample size. Generally, the larger the sample, the greater the study’s explanatory power. Additionally, randomly drawn samples are desirable because they leave any variation up to chance. Samples that are conducted out of convenience can be biased and non-representative of the larger population. In qualitative studies, non-random sampling is appropriate but consider this: how well does what we find for this group of people transfer to the people who will be in your study? For qualitative studies and quantitative studies, look for how well the sample is described and whether there are important characteristics missing from the article that you would need to determine the quality of the sample.
- Generalizability: Was it a convenience sample? Was the sampling frame generalizable? Did the study use probability sampling to recruit a large representative sample? Did the authors note challenges in recruitment or nonresponse bias in the limitations section?
- Transferability: Would the recruitment techniques described recruit people from my target population? Did this qualitative researcher use purposive sampling approaches or convenience?
- Positionality: If I wanted to answer a similar question in my research project, where might I propose to collect data?
Results
Key findings will be described very briefly in the abstract, and in much more detail in the article itself. In an empirical article, you should look at both the ‘Results’ and ‘Discussion’ sections. The discussion will contextualize the key findings, and often these are restated in less technical language than the results section. If the results section is incomprehensible to you, start with the discussion section to get a sense of the key findings.
- Generalizability: Assessing the p-values, odds ratios, confidence intervals, effect sizes, r-squared, and other values, what are the study’s key findings? Prioritize multivariate results.
- Transferability: Would the specific population in my research project likely demonstrate similar results? Did this qualitative researcher describe a context similar to my research project?
- Positionality: Is this what I expected? What connections can I draw with other studies? How does my perspective, the researchers’ perspective, and my target populations’ perspective differ?
Measures
How do researchers know something when they see it? Found in the ‘Methods’ section of empirical articles, the measures section is where researchers spell out the tools, or measures, they used to gather data. For quantitative studies, you will want to get familiar with the questions researchers typically use to measure key variables. For example, to measure domestic violence, researchers often use the Conflict Tactics Scale. The more frequently used and cited a measure is, the more we know about how well it works (or not).
Qualitative studies will often provide at least some of the interview or focus group questions they used with research participants. They will also include information about how their inquiry and hypotheses may have evolved over time. Keep in mind however, sometimes important information is cut out of an article during editing. If you need more information, consider reaching out to the author directly. Before you do so, check if the author provided an appendix with the information you need or if the article links to a their data and measures as part open data sharing practices.
- Generalizability: Did the study cite psychometric support for the validity and reliability of their measures?
- Transferability: Would these questions elicit a genuine and open response from my target population? Did this qualitative researcher account for their positionality in an open and honest way?
- Positionality: Would I use similar measurements? Does my project feel more quantitative or qualitative in orientation?
Your annotations
These are just a few suggested annotations, but you can come up with your own. For example, maybe there are annotations you would use for different assignments or for the problem statement in your research proposal. If you have an argument or idea that keeps coming to mind when you read, consider creating an annotation for it so you can remember which part of each article supports your ideas. Whatever works for you. The goal with annotation is to extract as much information from each article while reading, so you don’t have to go back through everything again. It’s useless to read an article and forget most of what you read. Annotate!
Key Takeaways
- Begin your search by reading thorough and cohesive literature reviews. Review articles are great sources of information to get a broad perspective of your topic.
- Don’t read an article just to say you’ve read it. Annotate and take notes so you don’t have to re-read it later.
- Use software or paper-and-pencil approaches to write notes on articles.
- Annotation is best used when closely reading an empirical study highly similar to your research project.
Exercises
- Select an empirical article highly related to the study you would like to conduct.
- Annotate the article using the aforementioned annotations and create some of your own.
- Create the first draft of a summary table with key information from this empirical study that you would like to compare to other empirical studies you closely read.
- McNeece, C. A., & Thyer, B. A. (2004). Evidence-based practice and social work. Journal of evidence-based social work, 1(1), 7-25. ↵
- It wouldn’t make any sense to say that people’s workplace experiences cause their gender, so in this example, the question of which is the independent variable and which are the dependent variables has a pretty obvious answer. ↵
- Cassidy, S. A., Dimova, R., Giguère, B., Spence, J. R., & Stanley, D. J. (2019). Failing grade: 89% of introduction-to-psychology textbooks that define or explain statistical significance do so incorrectly. Advances in Methods and Practices in Psychological Science, 2(3), 233-239. ↵
- Wasserstein, R. L., & Lazar, N. A. (2016). The ASA statement on p-values: context, process, and purpose. The American Statistician, 70, p. 129-133. ↵
- Wasserstein, R. L., & Lazar, N. A. (2016). The ASA statement on p-values: context, process, and purpose. The American Statistician, 70, p. 129-133. ↵
- Head, M. L., Holman, L., Lanfear, R., Kahn, A. T., & Jennions, M. D. (2015). The extent and consequences of p-hacking in science. PLoS biology, 13(3). ↵
- Peng, R. (2015), The reproducibility crisis in science: A statistical counterattack. Significance, 12, 30–32. ↵
- Wasserstein, R. L., & Lazar, N. A. (2016). The ASA statement on p-values: context, process, and purpose. The American Statistician, 70, p. 129-133. ↵
- Greenland, S., Senn, S. J., Rothman, K. J., Carlin, J. B., Poole, C., Goodman, S. N., & Altman, D. G. (2016). Statistical tests, P values, confidence intervals, and power: a guide to misinterpretations. European journal of epidemiology, 31(4), 337-350. ↵
- Bonanno, R., & Veselak, K. (2019). A matter of trust: Parents attitudes towards child mental health information sources. Advances in Social Work, 19(2), 397-415. ↵
report the results of a quantitative or qualitative data analysis conducted by the author
The ability to apply research findings beyond the study sample to some broader population,
whether a research result is applicable in another context or situation
uses the scientific method to analyze and improve the scientific production of knowledge (e.g., systematic review, meta-analysis)
a study that combines raw data from multiple quantitative studies and analyzes the pooled data using statistics
the group of people you successfully recruit from your sampling frame to participate in your study
sampling approaches for which a person’s likelihood of being selected from the sampling frame is known
sampling approaches for which a person’s likelihood of being selected for membership in the sample is unknown
the list of people from which a researcher will draw her sample
a sample that looks like the population from which it was selected in all respects that are potentially relevant to the study
The number of cases found in your final sample.
the percentage of people in the sample from whom data was collected, usually in a survey
a quick, condensed summary of the report’s key findings arranged by row and column
causes a change in the dependent variable
a variable that depends on changes in the independent variable
(as in generalization) to make claims about a large population based on a smaller sample of people or items
"Assuming that the null hypothesis is true and the study is repeated an infinite number times by drawing random samples from the same populations(s), less than 5% of these results will be more extreme than the current result" (Cassidy et al., 2019, p. 233).
the assumption that no relationship exists between the variables in question
“a logical grouping of attributes that can be observed and measured and is expected to vary from person to person in a population” (Gillespie & Wagner, 2018, p. 9)
summarizes the incompatibility between a particular set of data and a proposed model for the data, usually the null hypothesis. The lower the p-value, the more inconsistent the data are with the null hypothesis, indicating that the relationship is statistically significant.
a range of values in which the true value is likely to be, to provide a more accurate description of their data
the process of writing notes on an article
in a literature review, a source that describes primary data collected and analyzed by the author, rather than only reviewing what other researchers have found
